
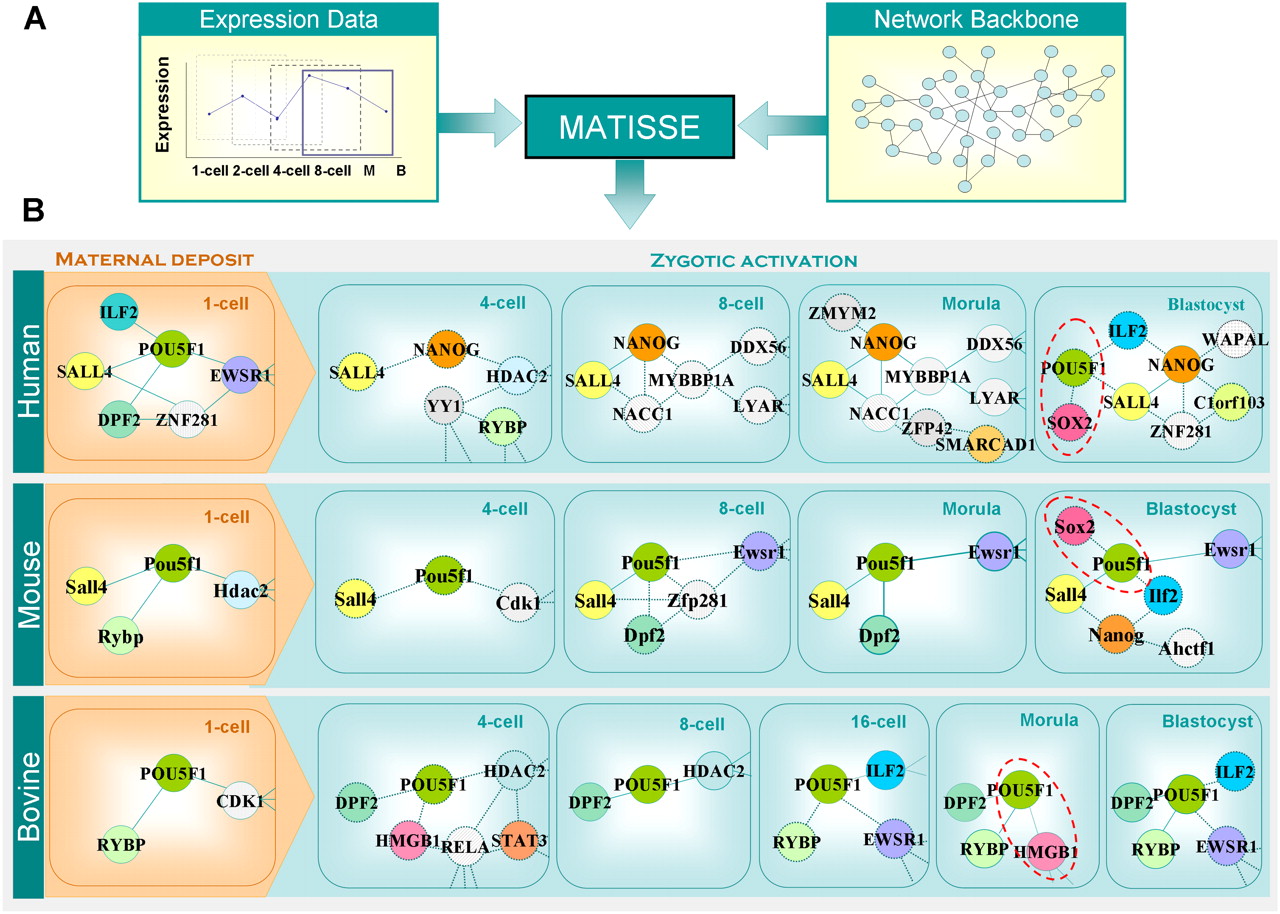
Figure 6.
Comparison of the state transition of GRN across species. For each time point in each species, the active state of a GRN module is drawn. The nodes represent the genes with detectable transcripts; the edges represent the predicted interactions of the connecting nodes. Interactions were predicted by the MATISSE program, using correlation of expression changes in a window of three time points centered at the current time point, and protein–protein interaction data.


