
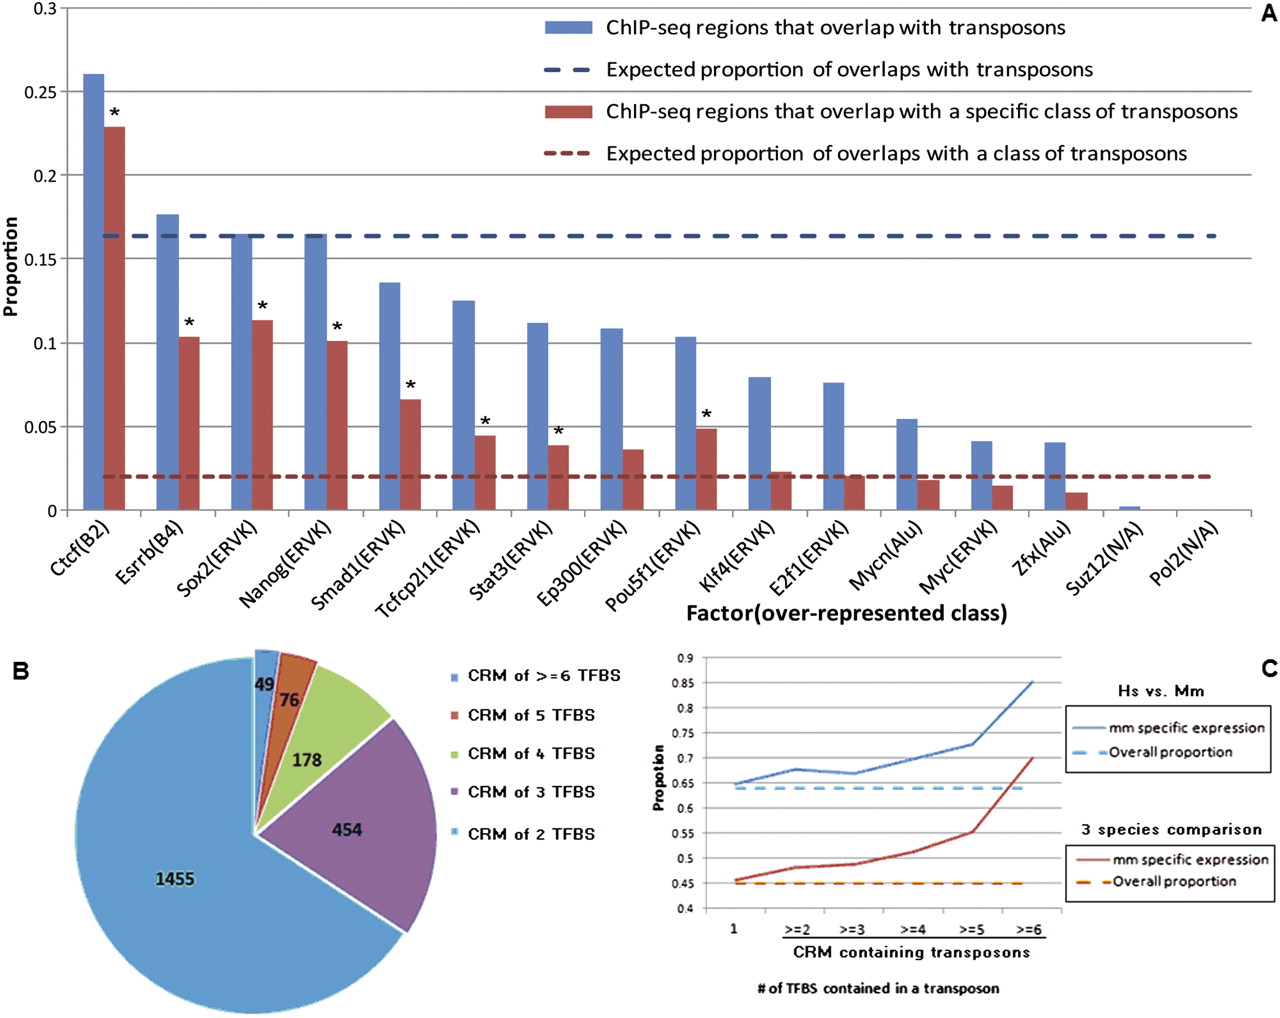
Figure 3.
CRM-containing transposons. (A) Proportions of mouse ChIP-seq detected binding regions that overlap with transposons (blue) and a specific class of transposons (red). An asterisk (*) denotes a specific class of transposons that is significantly overrepresented in the ChIP-seq detected regions. (B) Numbers of CRM-containing transposons detected by ChIP-seq. (C) The percentage of transposon-flanked genes with mouse-specific expression (solid lines) and the overall percentage of genes with mouse-specific expression (dashed lines).


