
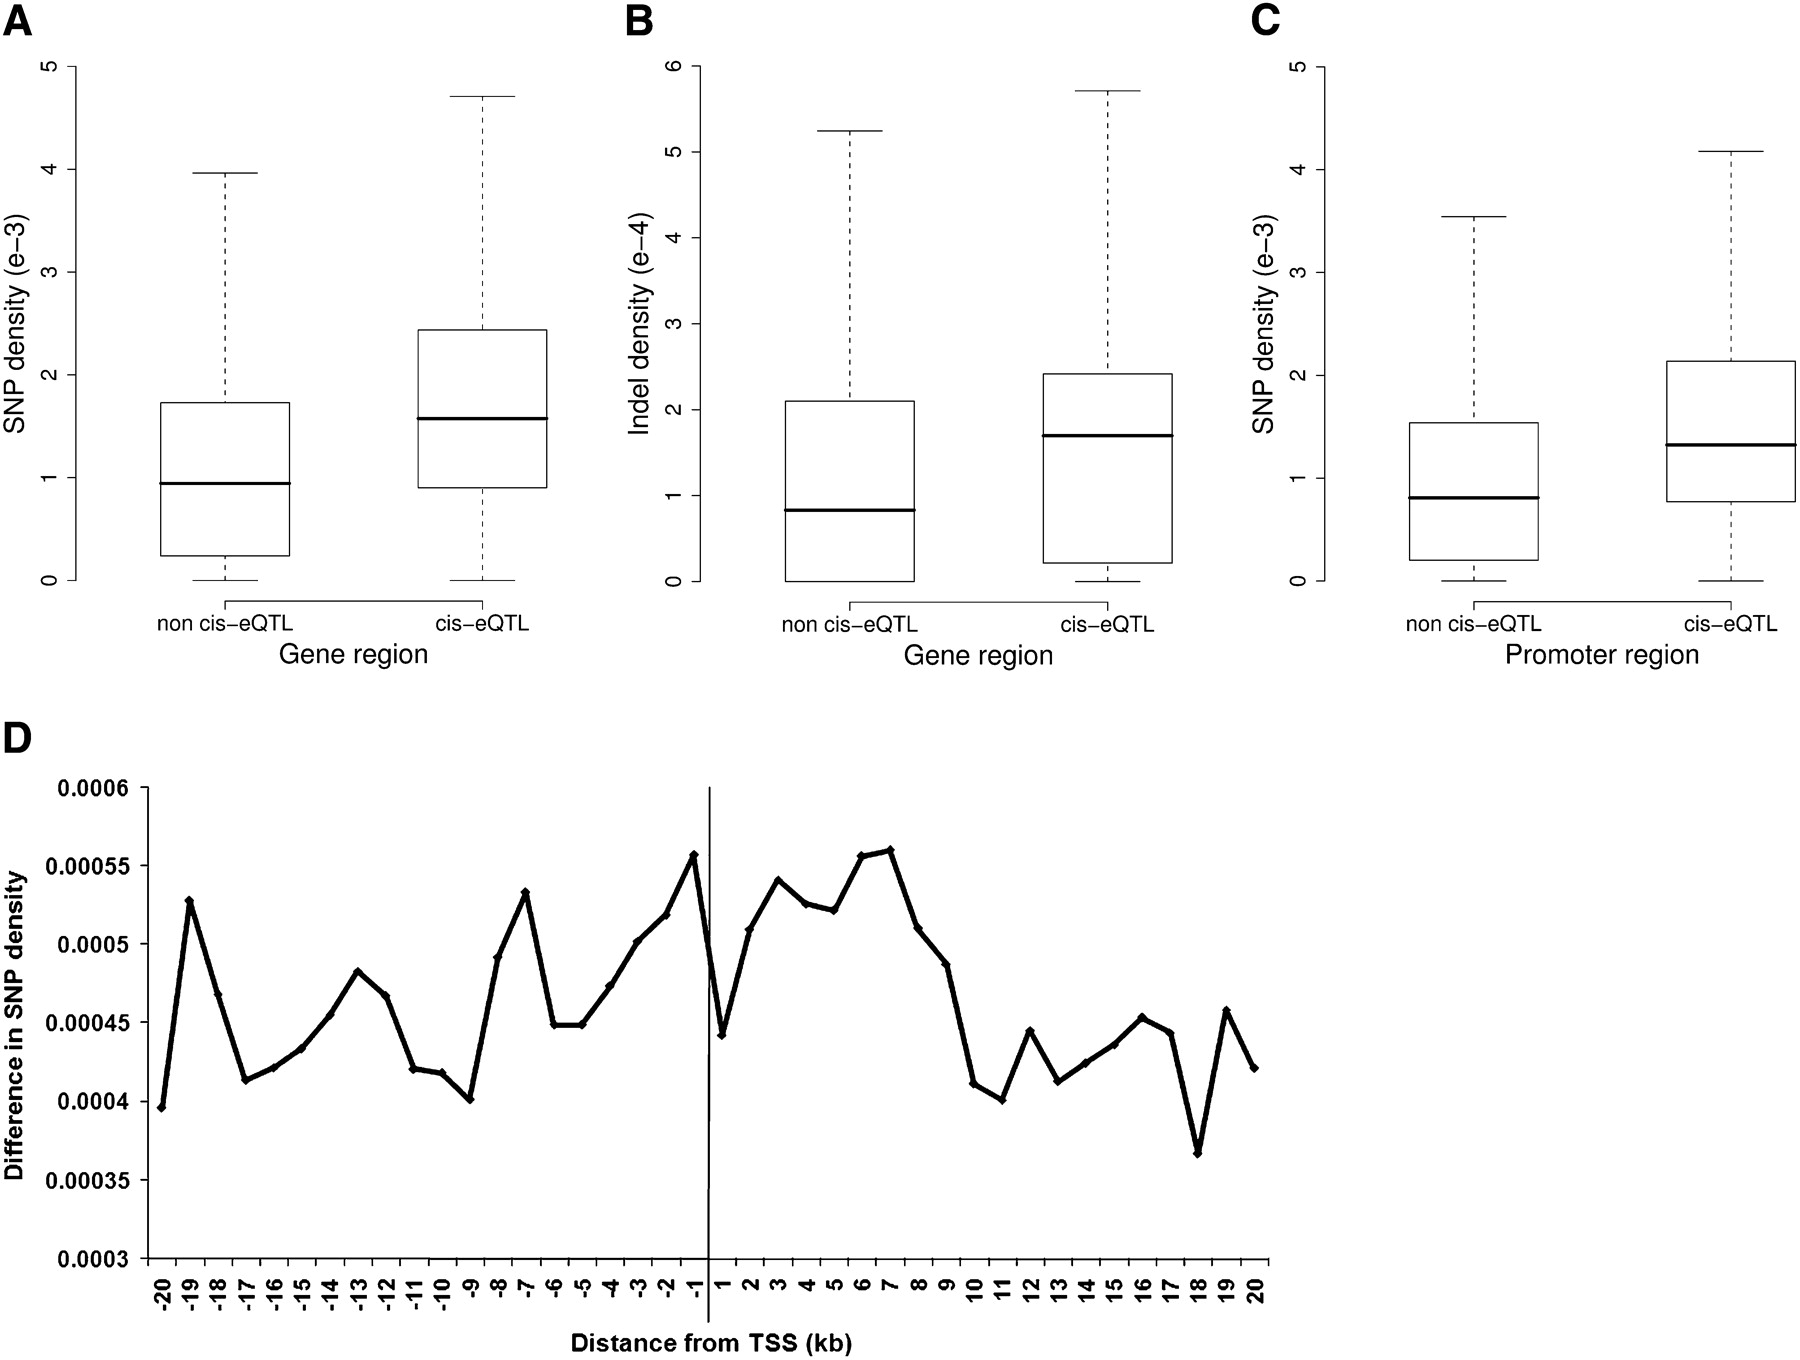
Figure 5.
SNP and indel enrichment in cis-eQTL gene regions and promoters. (A) Boxplot showing SNP density in gene regions containing cis-eQTL genes compared with regions containing only non-cis-eQTL genes. (B) Boxplot showing indel density in cis-eQTL-containing gene regions compared with non-cis-eQTL-containing gene regions. (C) Boxplot showing SNP density in a 10-kb region of the promoter, centered on the transcription start site, of cis-eQTL genes and non-cis-eQTL genes. (D) Distribution of SNP density between cis-eQTL genes and non-cis-eQTL genes in a 40-kb region surrounding the transcription start site. (Boxes and whiskers) Median, interquartile range, and 95th percentile.


