
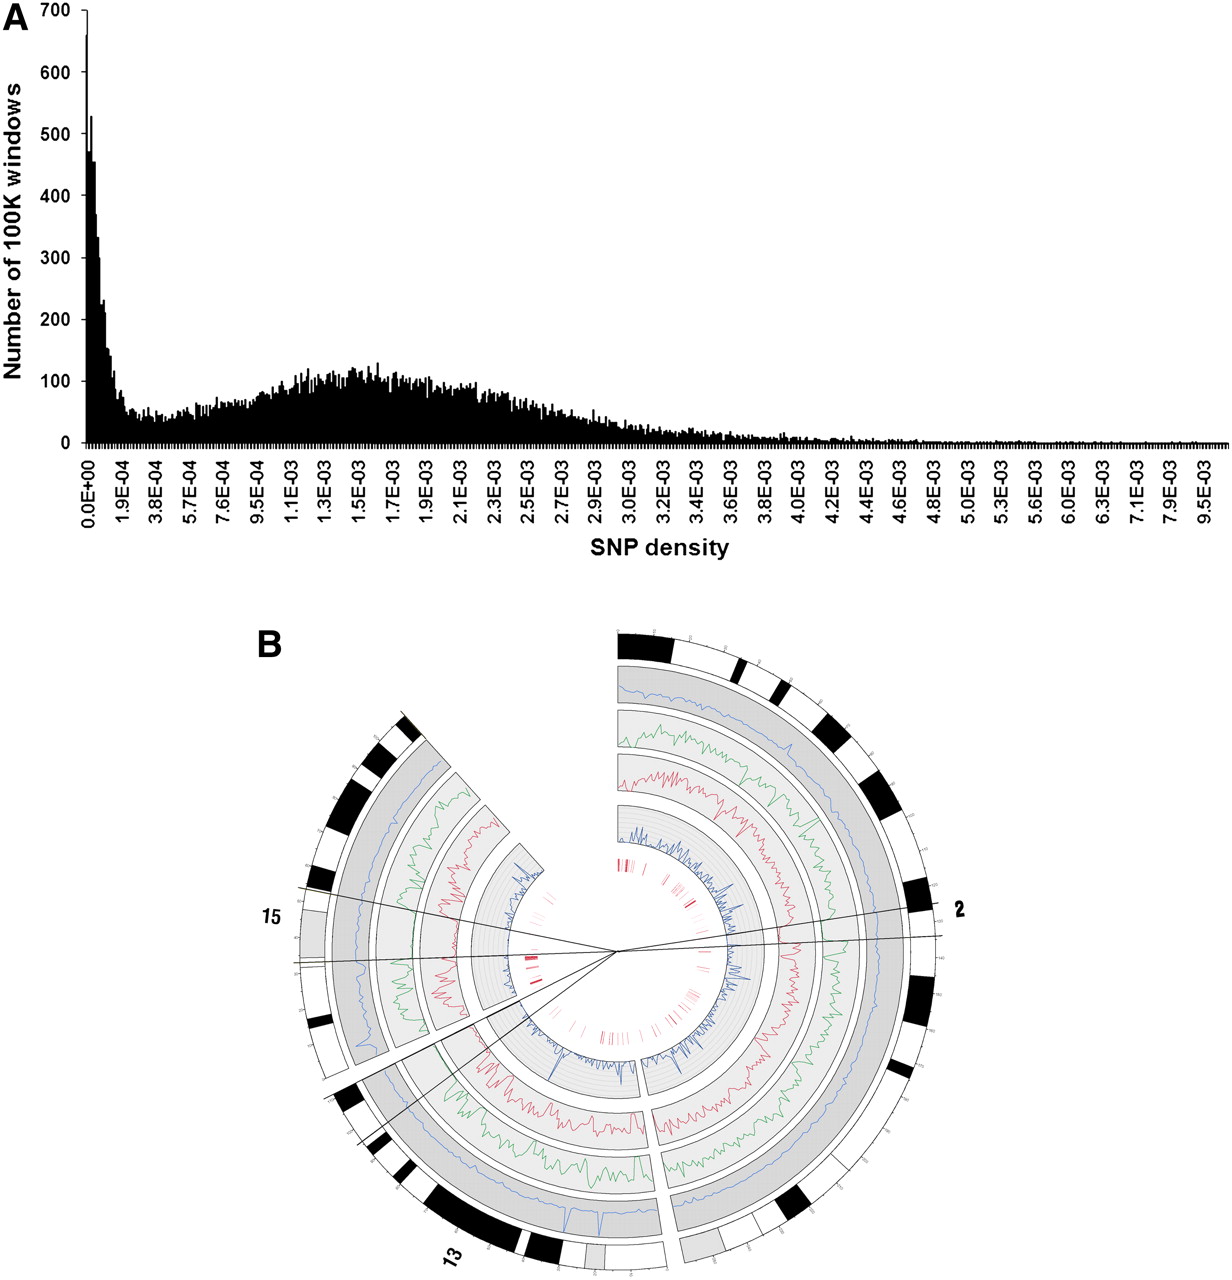
Figure 4.
Distribution and density of sequence variants. (A) Distribution of SNP density across the SHR/OlaIpcv genome, in 100-kb windows, calculated as in Figure 3. (B) Distribution of density of SNPs (green), indels (red), and larger deletions (blue inner circle) on SHR/OlaIpcv chromosomes 2, 13, and 15. (Blue outer circle) Sequence coverage of the SHR/OlaIpcv genome, (outermost circle) chromosomal banding, (innermost red bars) copy number variations.


