
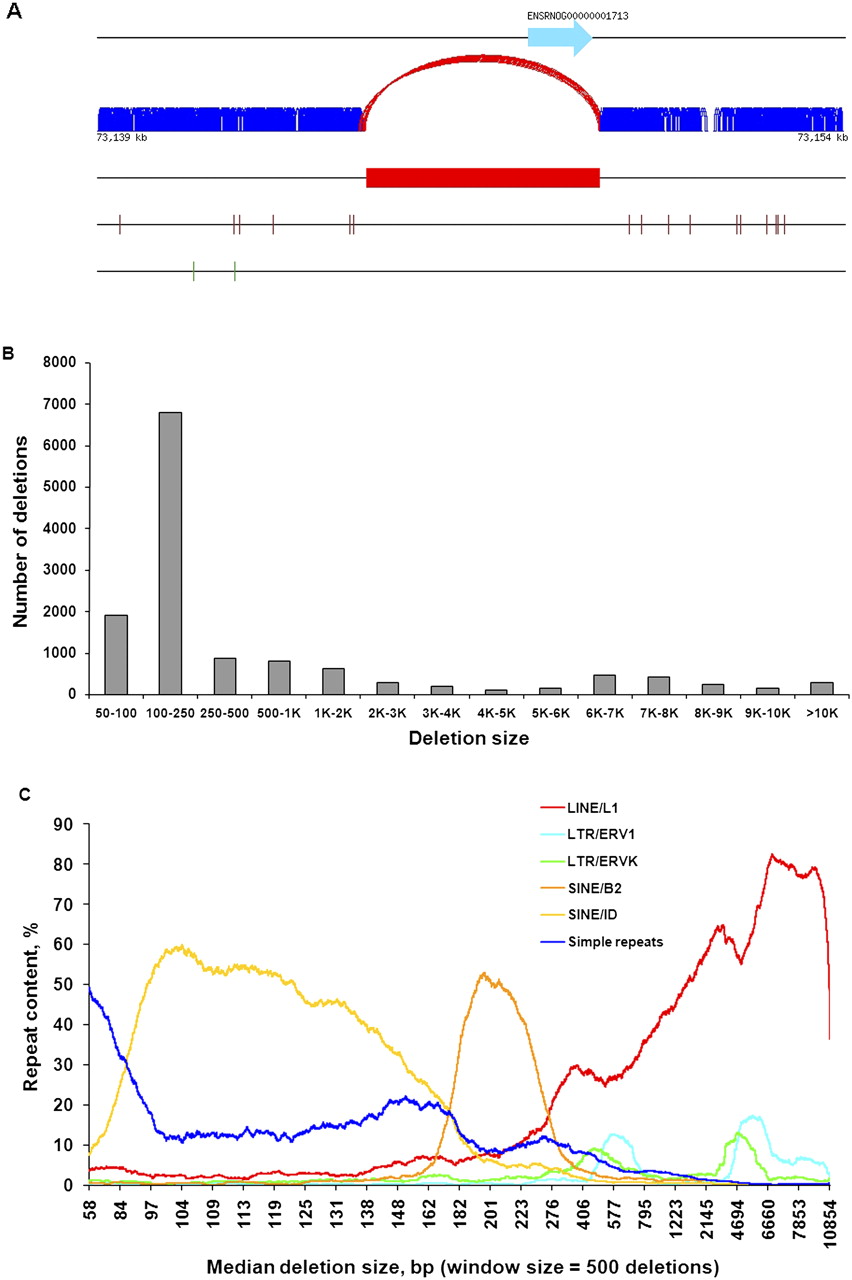
Method of calling, distribution, and repeat content of SHR/OlaIpcv deletions. (A) Deletion calling in SHR/OlaIpcv compared with the reference BN genome. SHR/OlaIpcv read pairs (dark blue) align with expected span size to the BN reference (top black line). (Red curve) SHR/OlaIpcv read pairs that align with span size greater than expected, (red box) region of deletion, (brown vertical lines) illustrative SNPs between the SHR/OlaIpcv and BN reference genomes, (green vertical lines) short indels, (light blue arrow) a gene in the BN reference. (B) Distribution of length of deletions identified in the SHR/OlaIpcv genome. (C) Rank analysis of repeat content in SHR deletions; each line represents a different type of repeat element. Deletions were ranked according to size and separated into bins of 500 deletions. Median size of deletion within each bin was plotted against content for each type of repeat element.


