
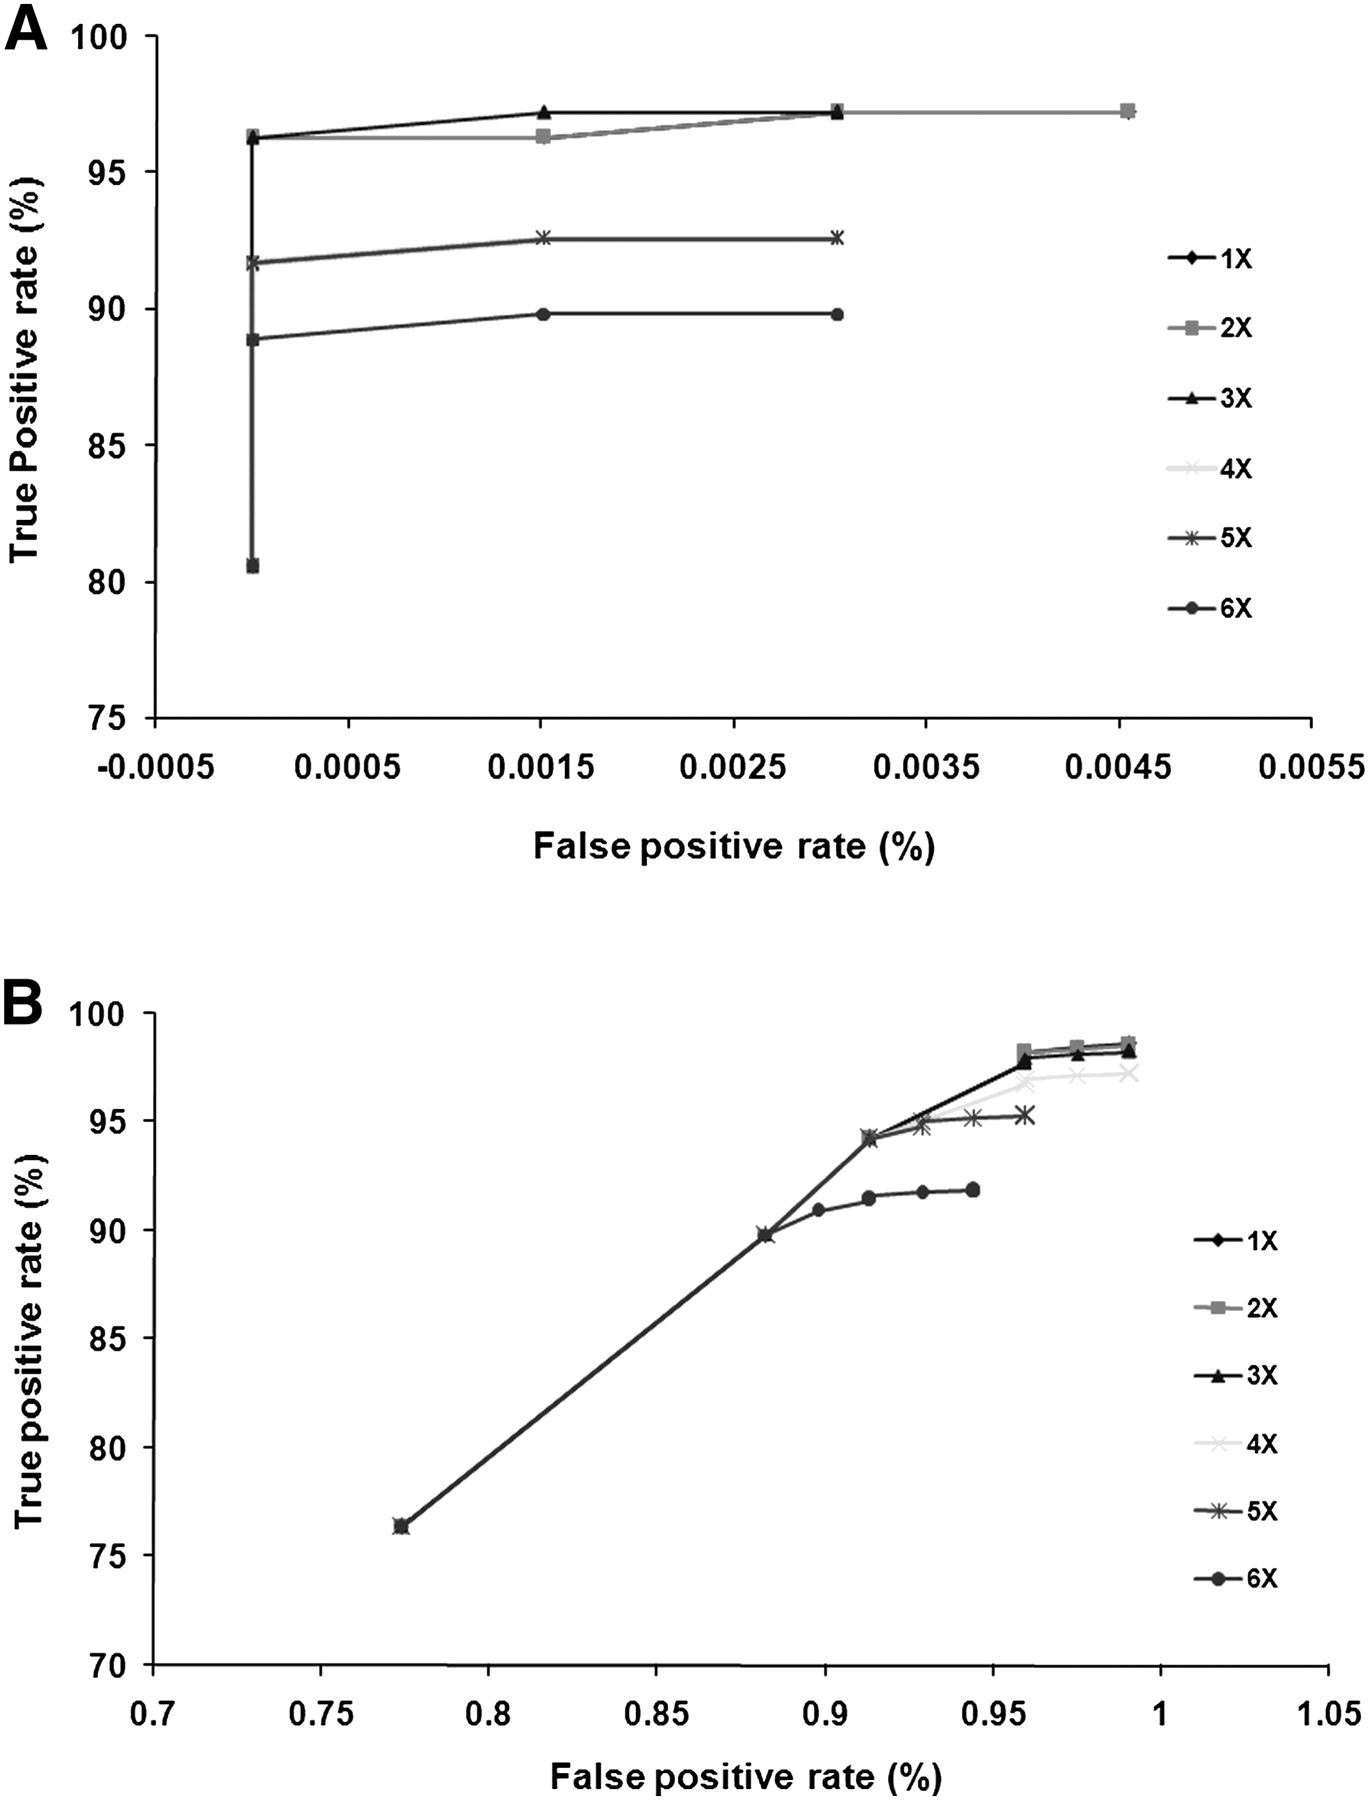
Figure 1.
Receiver operating characteristic (ROC) curves to determine optimal thresholds for SNP calling. Evaluation of sensitivity and specificity of SNP prediction using Illumina paired-end sequencing at various read depths and quality scores compared with 108 SNPs predicted in a 66-kb region of the genome sequenced using capillary sequencing (A) and the STAR SNP data set (B). Each curve represents a different read depth, and each point represents different consensus quality scores.


