
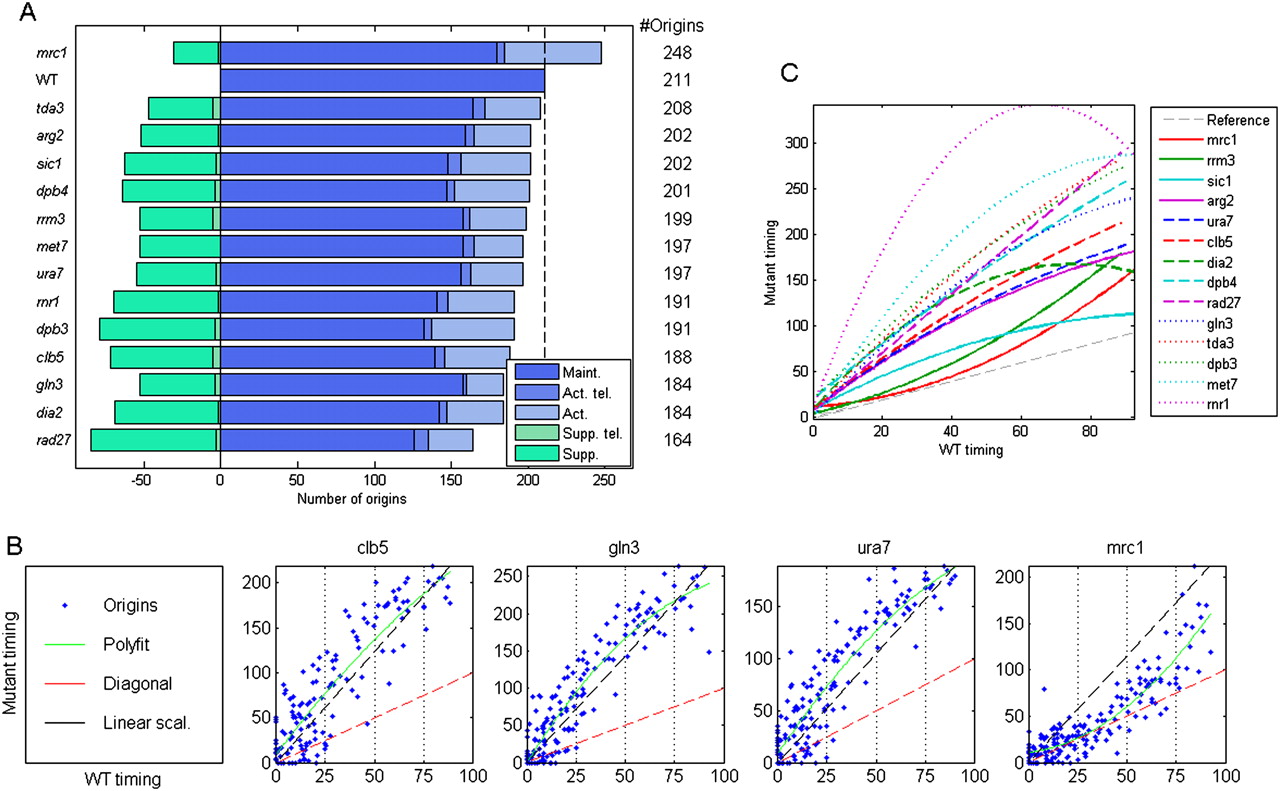
Scaling of the replication profiles. (A) Number of replication origins in each mutant. The broken vertical line represents the number of origins active in the wild-type strain. Total active origins are further divided into origins that appear in both the wild type and mutant (maintained, “Maint.”) and those that appear only in the mutant (activated, “Act.”). This later group is further divided into telomeric origins (“Act. tel.”; this includes the rDNA borders) and nontelomeric origins. Green bars represent origins that appear in the wild type but not in the mutants (suppressed, “Supp.”), again divided into these found in telomeric (“Supp. tel.”) vs. nontelomeric regions. (B) Scaling in all mutants apart from the mrc1 deletion strain: For each mutant, the scatter plot shows the activation timing of each maintained origin in the mutant (y-axis) as a function of its activation time in the wild type (x-axis). The wild-type data are scaled to 0–100, and the mutant data are scaled according to the relative length of S phase. Red broken lines represent identical timing between the wild type and mutant. The green line is a second-order polynomial fit to the data. The black broken line represents a perfect linear scaling. Typically, origin activation times are delayed more than by a linear factor. All mutants are shown in Supplemental Figure S5. (C) All polynomial fits (as in B) are shown together for comparison. The broken gray line represents no delay in origin activation. The differences between mrc1 and rrm3 and sic1 are more pronounced than apparent from this comparative figure when taking into account the significantly longer S phase of mrc1 cells (see B).


