
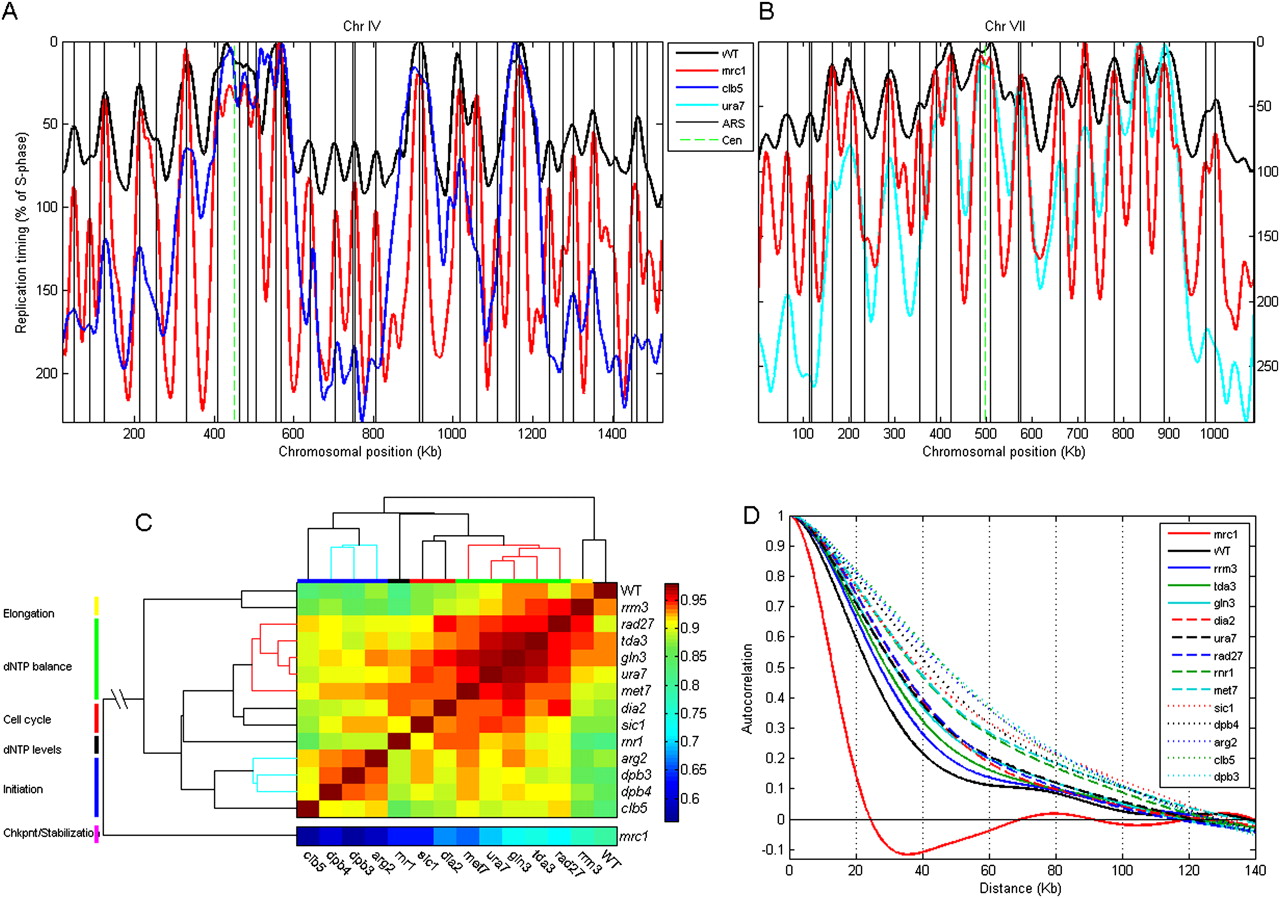
Replication timing profiles of the mutants identified in our screen. (A,B) Replication profiles of chromosome IV (A) and VII (B) for wild-type, mrc1, and either clb5 (A) or ura7 (B). Axes, legends, and vertical lines are as in Fig. 3B, with the exception that the y-axis is scaled according to the length of S phase in each of the mutants. Other mutants and chromosomes are shown in Supplemental Figure S3. (C) Clustered correlation matrix of the entire data set. The dendrogram distance to mrc1 is not to scale (broken lines). Functional classifications are based on the literature, the FACS results, and analysis of the microarray data described in the main text. Correlations were calculated between the smoothed averages of four biological repeats, as described above (Fig. 3). See Supplemental Figure S4 for correlation between individual repeats. (D) Autocorrelations (calculated as in Fig. 3C) of the different mutants: Strains are ordered by increasing values of autocorrelation at 50 kb. Autocorrelation shown here was calculated using the smoothed profile. See Supplemental Figure S4 for autocorrelations for the raw data.


