
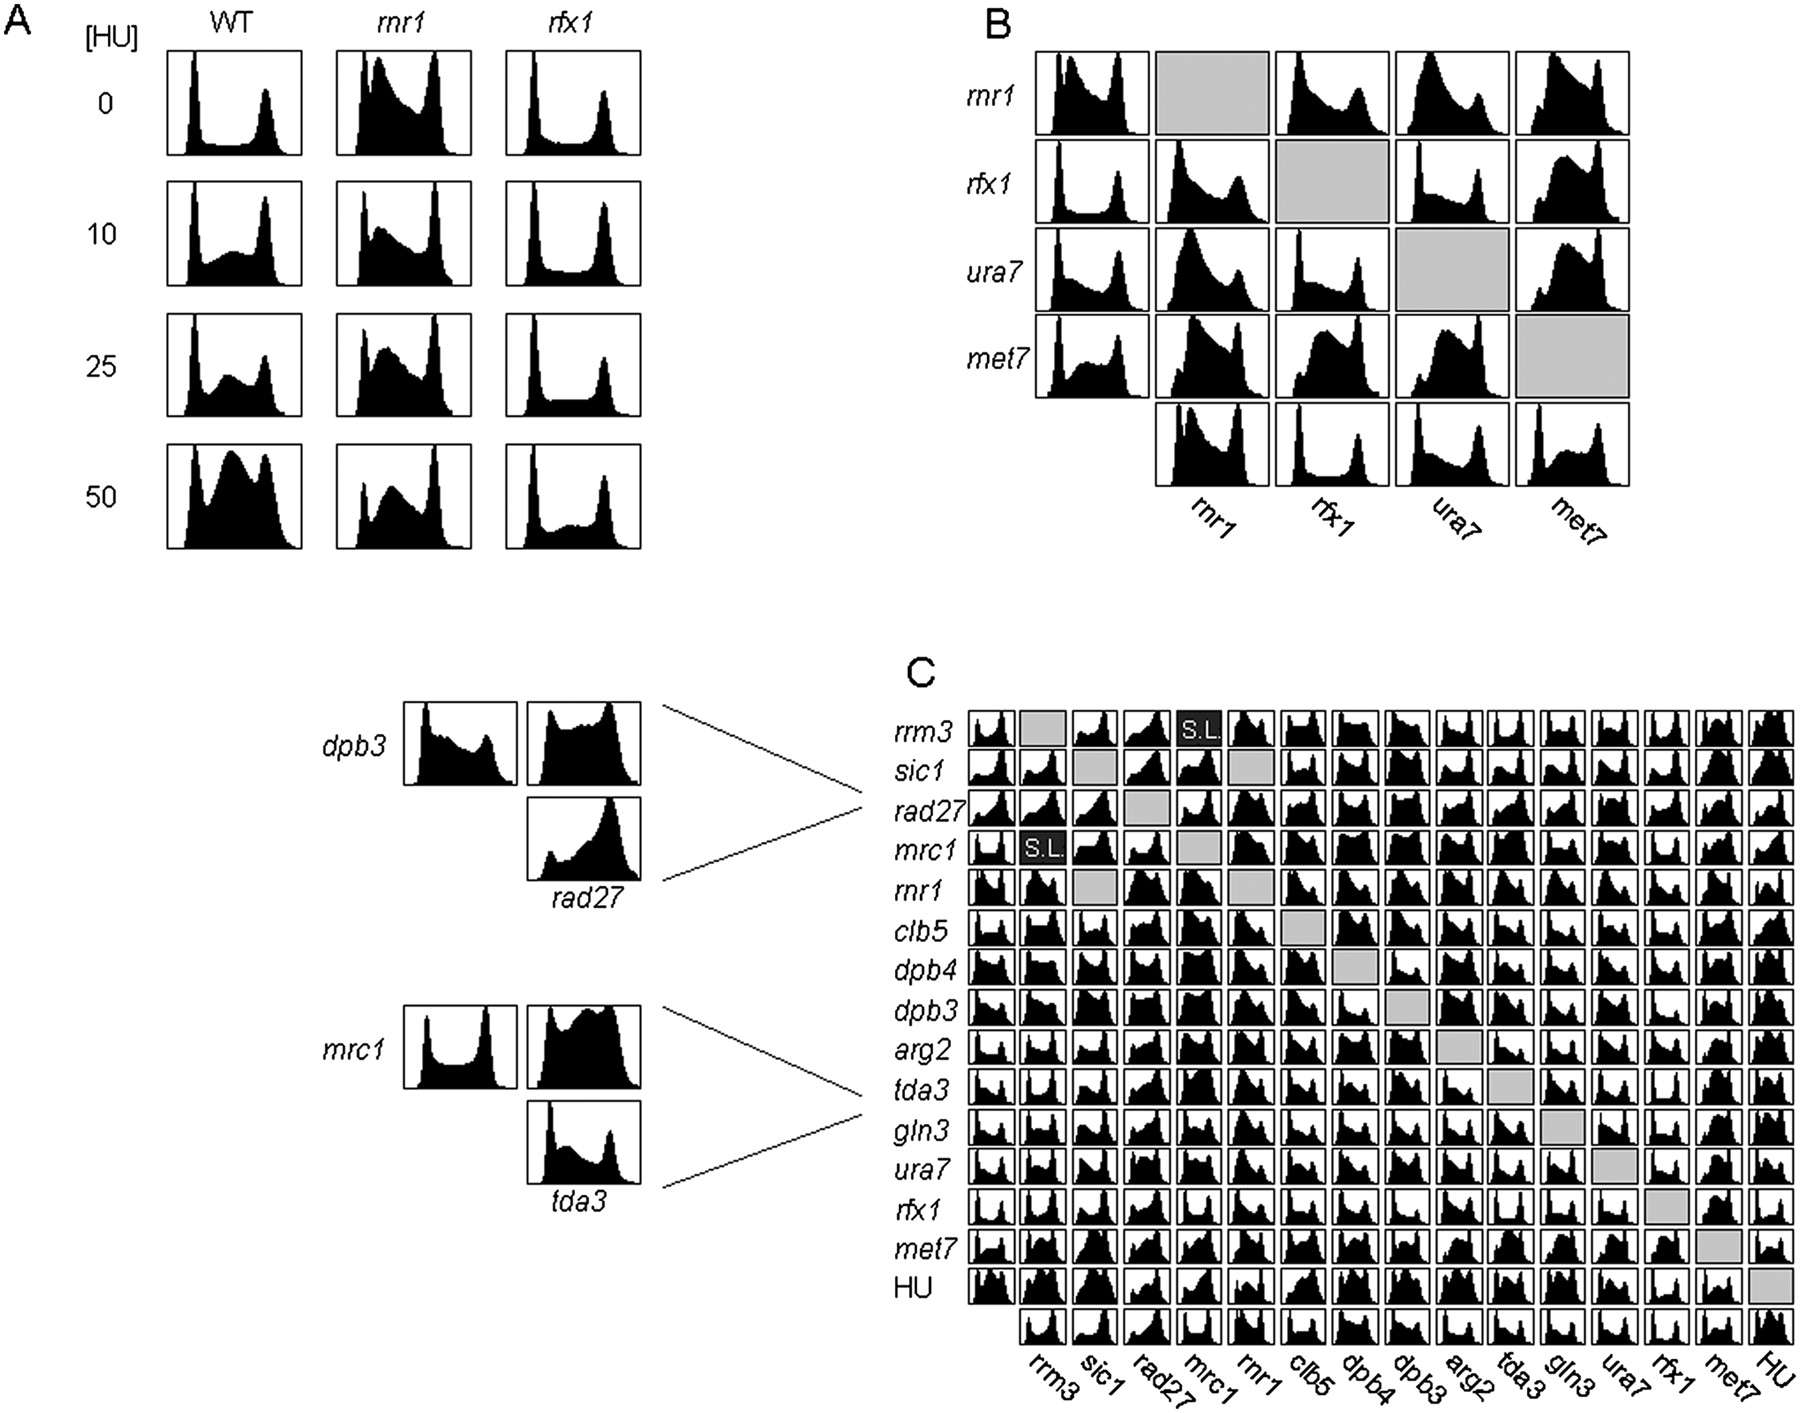
Genetic characterization of S-phase mutants. (A) FACS profiles of the indicated cells treated with different dosage of HU. The large G2 fraction of HU-treated rnr1 cells may be overestimated because of some difficulties in discriminating doublets (data not shown). (B) Synthetic interactions between genes associated with dNTP synthesis. FACS profiles are shown for mutants deleted of all gene-pair combinations. (C) A complete epistatic miniarray profile (E-Map) for the genes identified in our screen. Genetic interaction scores were computed and used to cluster the matrix (see Methods). (SL) Synthetic lethal. (Gray boxes) No data. Two cases that resulted in particularly long S phases are at left: dpb3 rad27 and mrc1 tda3. Note the strong aggravating interaction in mid-to-late S phase not evident in either of the single mutants.


