
Figure 1.
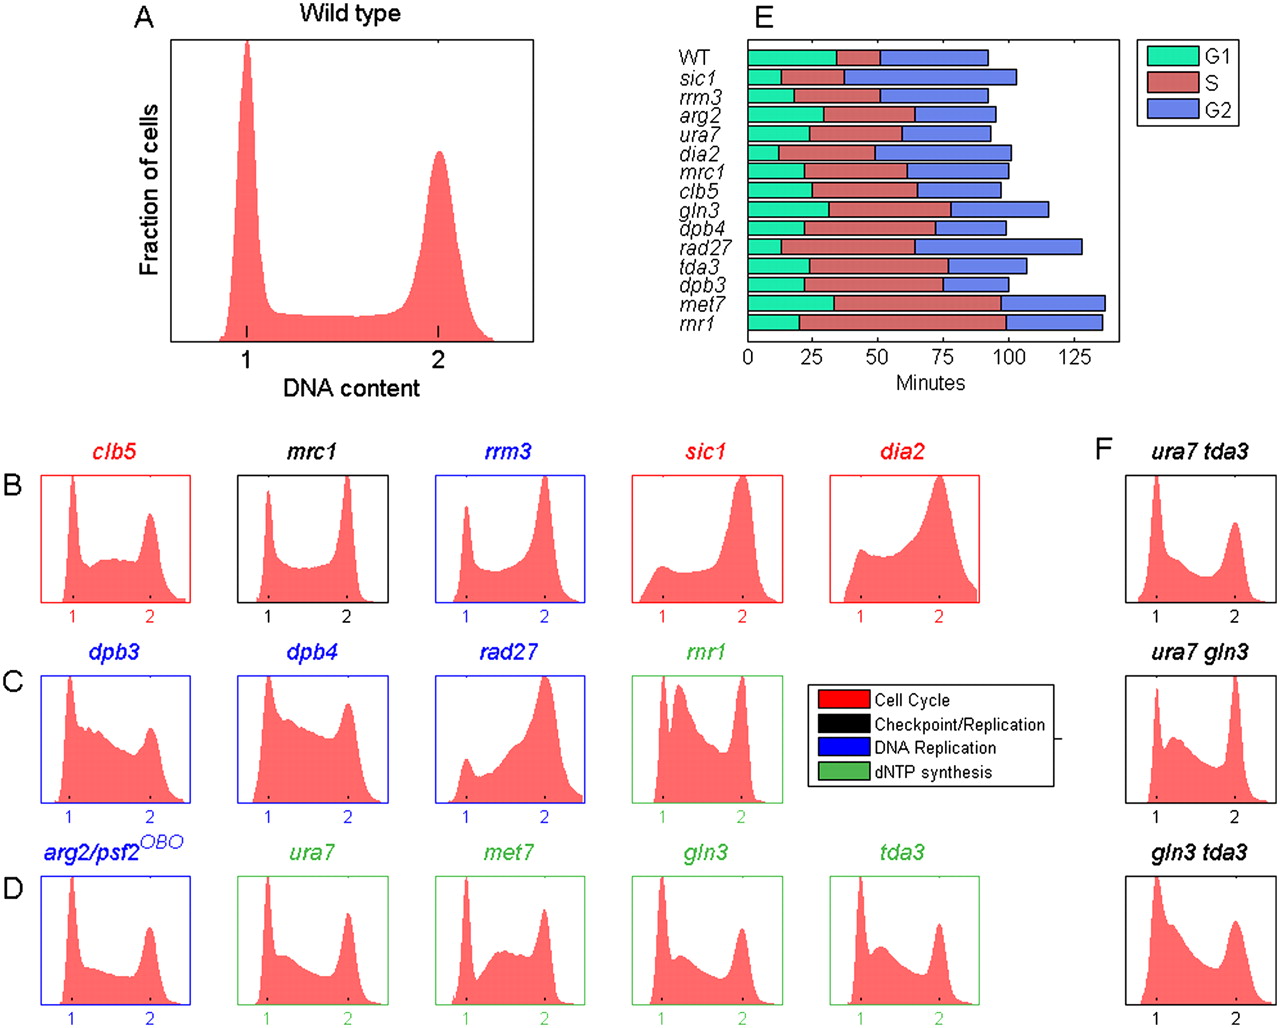
A screen for genes with extended S phase. (A–D) Distribution of DNA content (“FACS profiles”) in asynchronous populations of wild-type cells (BY4741) (A) and cells identified in the screen (B–D). All FACS profiles were reproduced at least eight times. The color codes of the titles and axes in B–D denote known functional classifications of the genes. (OBO) Off-by-one (Pan et al. 2006). (E) Generation time and duration of each cell-cycle phase for the different mutants. Ordering is S phase duration. See Supplemental Table S2 for the raw data and summary of the genes and phenotypes. (F) FACS profiles of double mutant combinations as indicated.


