
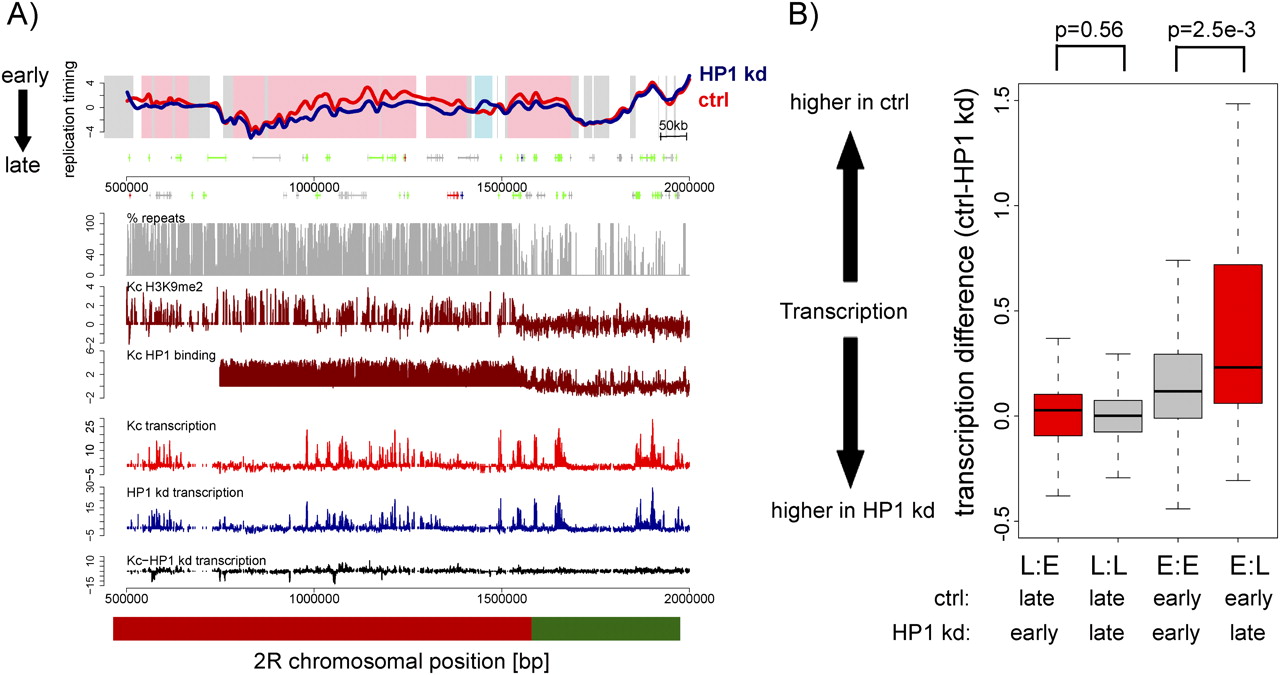
Differences in replication timing do frequently but not always coincide with transcription differences. (A) Replication timing profiles of control (red, ctrl) and HP1 knockdown (blue, HP1 kd) Kc cells for a representative region on chromosome 2R. X-axis, chromosomal position in base pairs; y-axis, log2 (early/late replication). Background coloring denotes regions that replicate earlier in HP1 kd cells (L:E, pink), regions that replicate earlier in control cells (E:L, blue), and regions replicating similarly in both cell types (white). Annotated genes are displayed below the profile (boxes, exons; lines, introns; small boxes, UTRs) and colored by their expression status (for details, see Methods; green, expressed in control and HP1 kd cells; blue, expressed only in HP1 kd cells; red, expressed only in control cells; gray, not expressed in control and HP1 kd cells). Transcription levels of control (red) and HP1 kd (blue) cells measured by tiling arrays are displayed on the same scale below, including transcription level differences (black). The direction toward the centromere (cen) is marked by an arrow, and the parts of the figure that we refer to in the main text as pericentric heterochromatin (red bar) and euchromatin (green bar) are indicated. (B) Distribution of transcription differences (control-HP1 kd transcription levels) for regions with differential replication timing. The boxplots illustrate that on average differences in replication timing coincide with changes in transcription. L:E, regions replicating earlier in HP1 kd cells; L:L, regions replicating late in both; E:E, regions replicating early in both; E:L, regions replicating earlier in control cells. P-values were calculated using the Wilcoxon rank sum test.


