
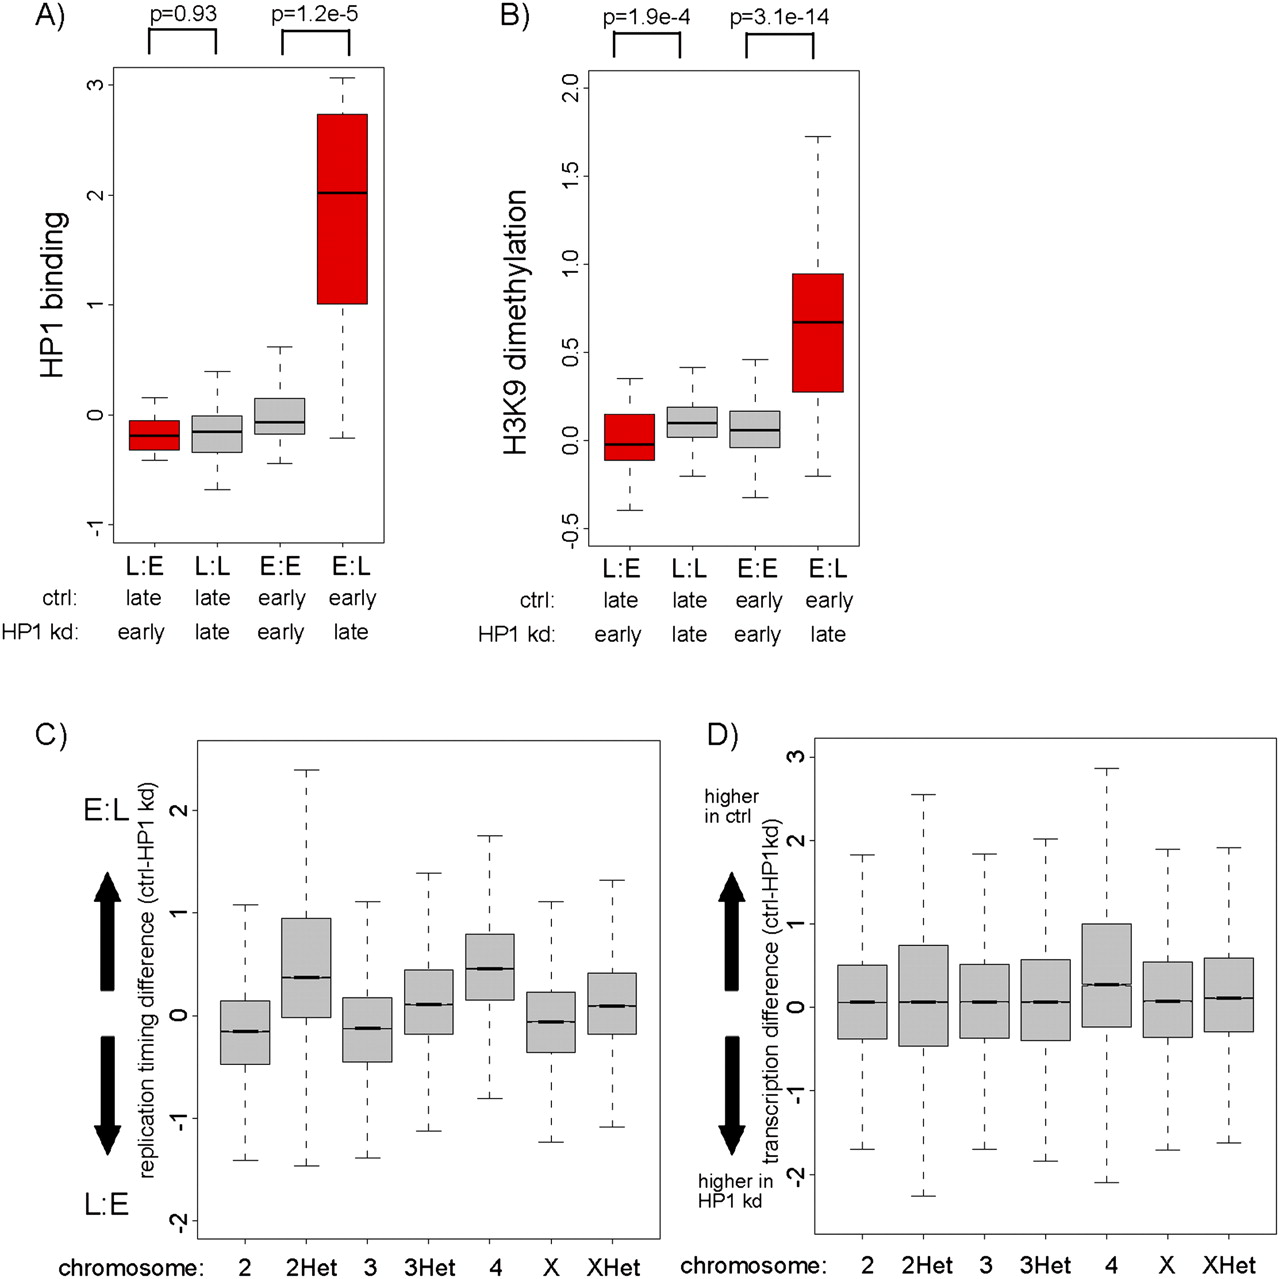
Delayed replication timing of HP1- and H3K9me2-positive chromatin. (A) Distribution of HP1 binding levels (de Wit et al. 2007) for regions with differential replication timing. The boxplots illustrate that regions with delayed replication after HP1 knockdown (E:L) show high levels of HP1 binding. L:E, regions replicating earlier in HP1 kd cells; L:L, regions replicating late in both; E:E, regions replicating early in both; E:L, regions replicating earlier in control cells. P-values were calculated using the Wilcoxon rank sum test. (B) Distribution of H3K9me2 for regions with differential replication timing. The boxplots illustrate that regions replicating later after HP1 knockdown (E:L) show high levels of H3K9me2. L:E, regions replicating earlier in HP1 kd cells; L:L, regions replicating late in both; E:E, regions replicating early in both; E:L, regions replicating earlier in control cells. P-values were calculated using the Wilcoxon rank sum test. (C) Distribution of replication timing differences (control-HP1 kd RNAi replication timing, log2 scale, y-axis) on different chromosomes. The individual boxplots represent the distribution of control minus HP1 kd replication timing of all array probes on the indicated chromosome. The boxplots illustrate that chromosome 4 (4, P-value < 2.2 × 10⁻¹⁶) and pericentric regions on chromosome 2 (2Het, P-value < 2.2 × 10⁻¹⁶), and to a lesser extent on chromosome 3 and X (3Het, XHet, P-value < 2.2 × 10⁻¹⁶), show delayed replication timing (E:L) more often than euchromatin on chromosome 2,3 and X (2,3, X). (D) Distribution of transcription differences (control-HP1 RNAi transcription, log2 scale, y-axis) within different chromosomes. The boxplots illustrate that chromosome 4 (4, P-value < 2.2 × 10⁻¹⁶) shows reduced transcription levels in HP1 knockdown cells (higher in control) more frequently than other chromosomes.


