
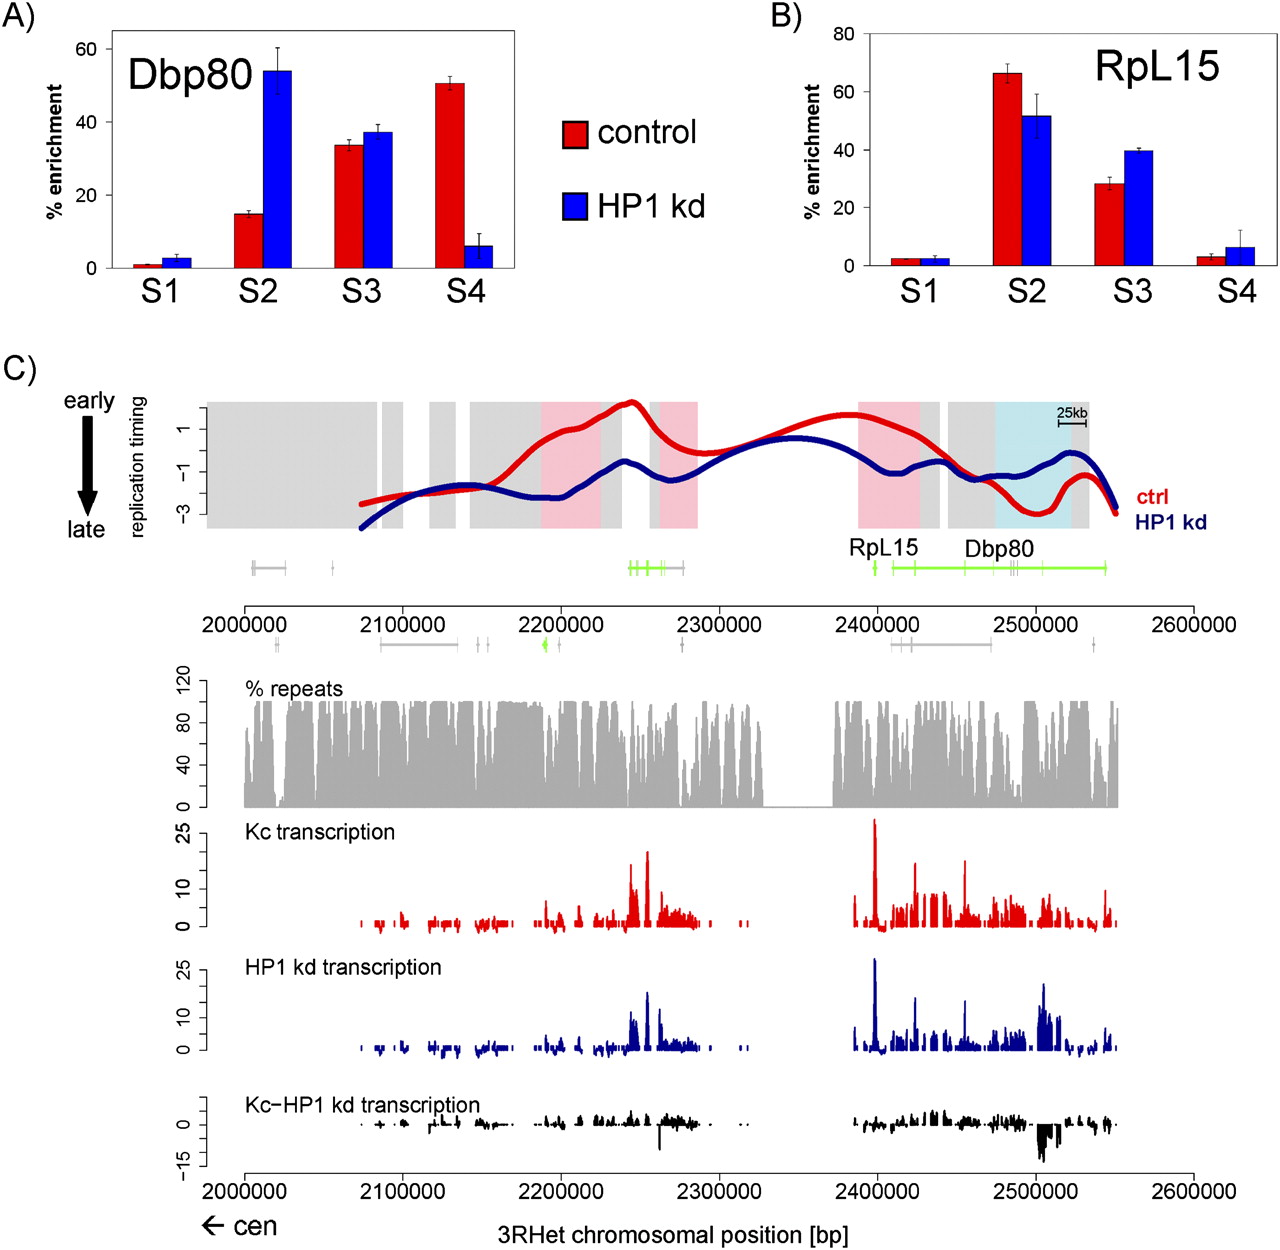
Differences in replication timing at heterochromatic genes. (A) Enrichments of BrdU containing DNA in four FACS sorted fractions (S1–S4) as quantified by real-time PCR with primers specific for the 3′ region of the Dbp80 gene. (B) Enrichments of BrdU containing DNA in four FACS sorted fractions (S1–S4) as quantified by real-time PCR with primers specific for the RpL15 gene. S1 represents the earliest and S4 the latest S-phase fraction as measured by DNA content. Error bars, SD between three biological repeats. (C) Replication timing profiles of control (red, ctrl) and HP1 knockdown (blue, HP1 kd) Kc cells for a representative region of pericentric heterochromatin on chromosome 3L (3LHet). X-axis represents 3LHet chromosomal position in base pairs; y-axis, log2 (early/late replication). Background coloring denotes regions that replicate earlier in HP1 kd cells (L:E, blue), regions that replicate earlier in control cells (E:L, pink), and regions replicating similarly in both cell types (white). Gene annotation is displayed below the profile (boxes, exons; lines, introns; small boxes, UTRs) and colored by expression status (for details, see Methods; green, expressed in control and HP1 kd cells; blue, expressed only in HP1 kd cells; red, expressed only in control cells; gray, not expressed in control and HP1 kd cells). The sequence analyzed in B overlaps with the Dbp80 exon and is located immediately to the right of the 2,500,000-bp marker. (Below) Transcription levels of control (red) and HP1 kd (blue) cells measured by tiling arrays are displayed, including transcription level differences (black). Repeat density is indicated as the percentage of repetitive element within 2-kb windows (gray; for details, see Methods). The direction toward the centromere (cen) is marked by an arrow.


