
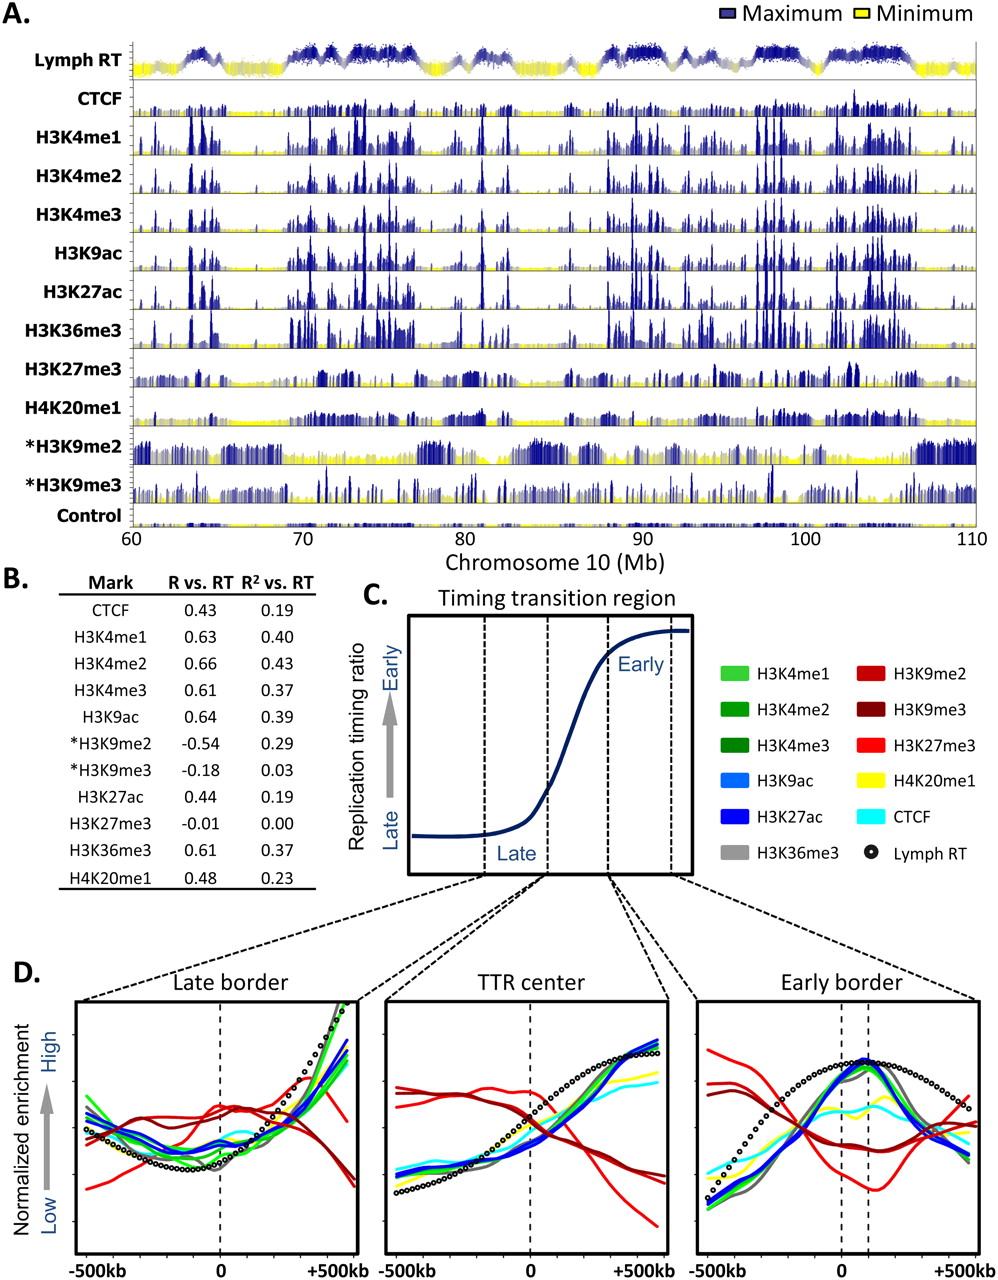
A chromatin signature for replication domain boundaries. (A) Profiles of lymphoblastoid replication timing, CTCF, and the indicated histone modifications are shown for a representative 50-Mb region of chromosome 10. ChIP-seq data and the input control profile are from GM12878 lymphoblastoid ChIP-seq experiments hosted on the UCSC Genome Browser (Rosenbloom et al. 2010), with the exception of H3K9me2 and H3K9me3 (asterisk), obtained from CDT4+ T-cells (Barski et al. 2007). (B) Domain-wide relationship between replication timing and histone modifications. Pearson R and R2 values of domain replication timing with each mark above were calculated as in Hiratani et al. (2008). (C) A diagrammatic timing transition region, in which windows of 1 Mb surrounding the late border, center, and early border are highlighted. (D) Average profiles of histone marks, CTCF, and replication timing are shown for the windows indicated in C.


