
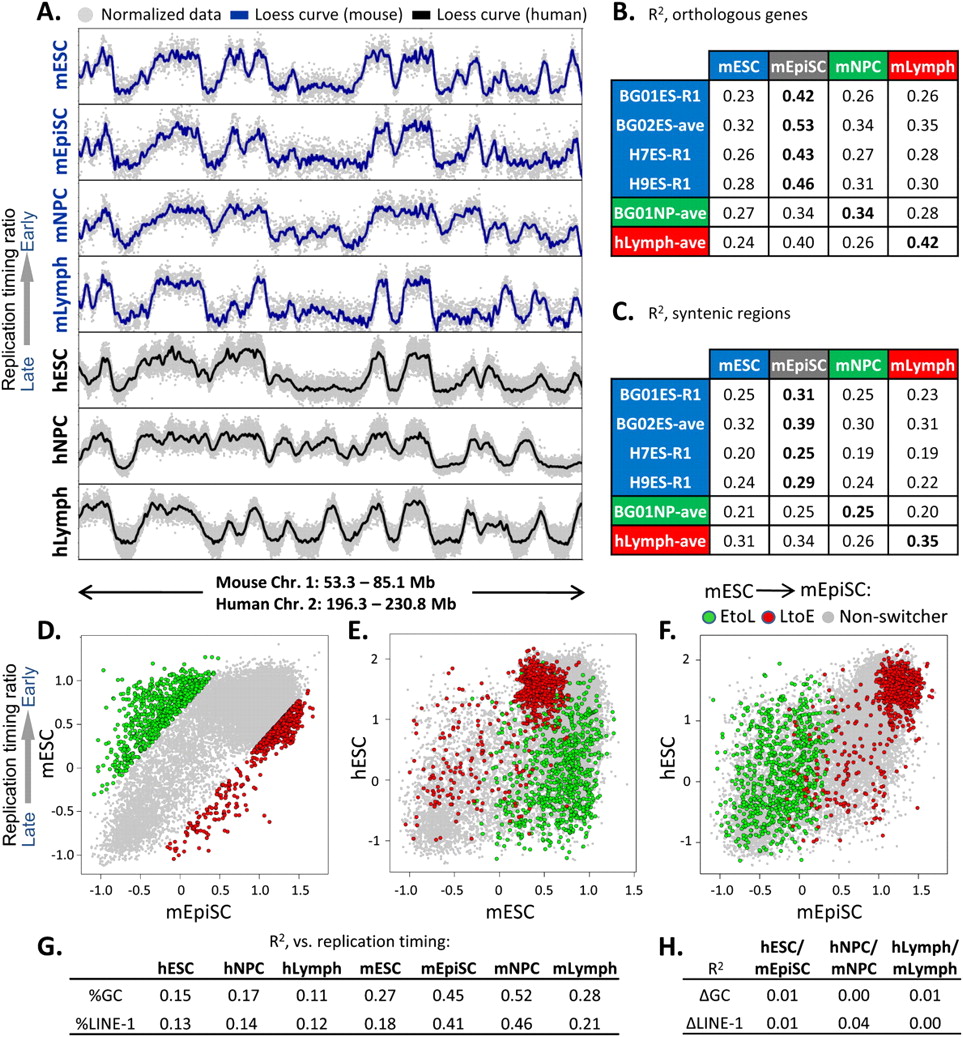
Significant conservation of replication timing between hESCs and mEpiSCs. (A) Example of RT conservation between the indicated human and mouse cell types in one of 207 syntenic regions. (B) Correlation of replication timing (R2 values) between the indicated human and mouse cell types at 16,629 orthologous gene promoters. All mouse data are the averages of biological replicates, while both averaged replicates (ave) and exemplary single replicates (R1) are shown for human cell types. R2 differences ≥0.02 are statistically significant at P < 0.05 using Fisher R-to-Z transformation. (C) 207 syntenic regions >1 Mb were loess smoothed, and RT values were gathered at 100 equal intervals per window to obtain correlations of replication timing in syntenic regions. The significance of these alignments was calculated using bootstrapping (P < 0.0001), as described in the Methods. (D–F) Replication timing for orthologous genes with the top 5% of EtoL and LtoE timing changes in mESCs vs. mEpiSCs (D; [green] EtoL, [red] LtoE, [gray] non-switching) was compared with BG01 hESCs (E,F). Genes that transition from EtoL between mESCs and mEpiSCs generally remain late-replicating in hESCs. (G) Pearson R2 values between domain-wide replication timing and LINE-1 density or GC content are shown for the cell types indicated. Mouse data are from Hiratani et al. (2008, 2010). (H) Conservation (R2) between syntenic regions as in Figure 3C shows little relationship to differences in regional GC or LINE-1 content.


