
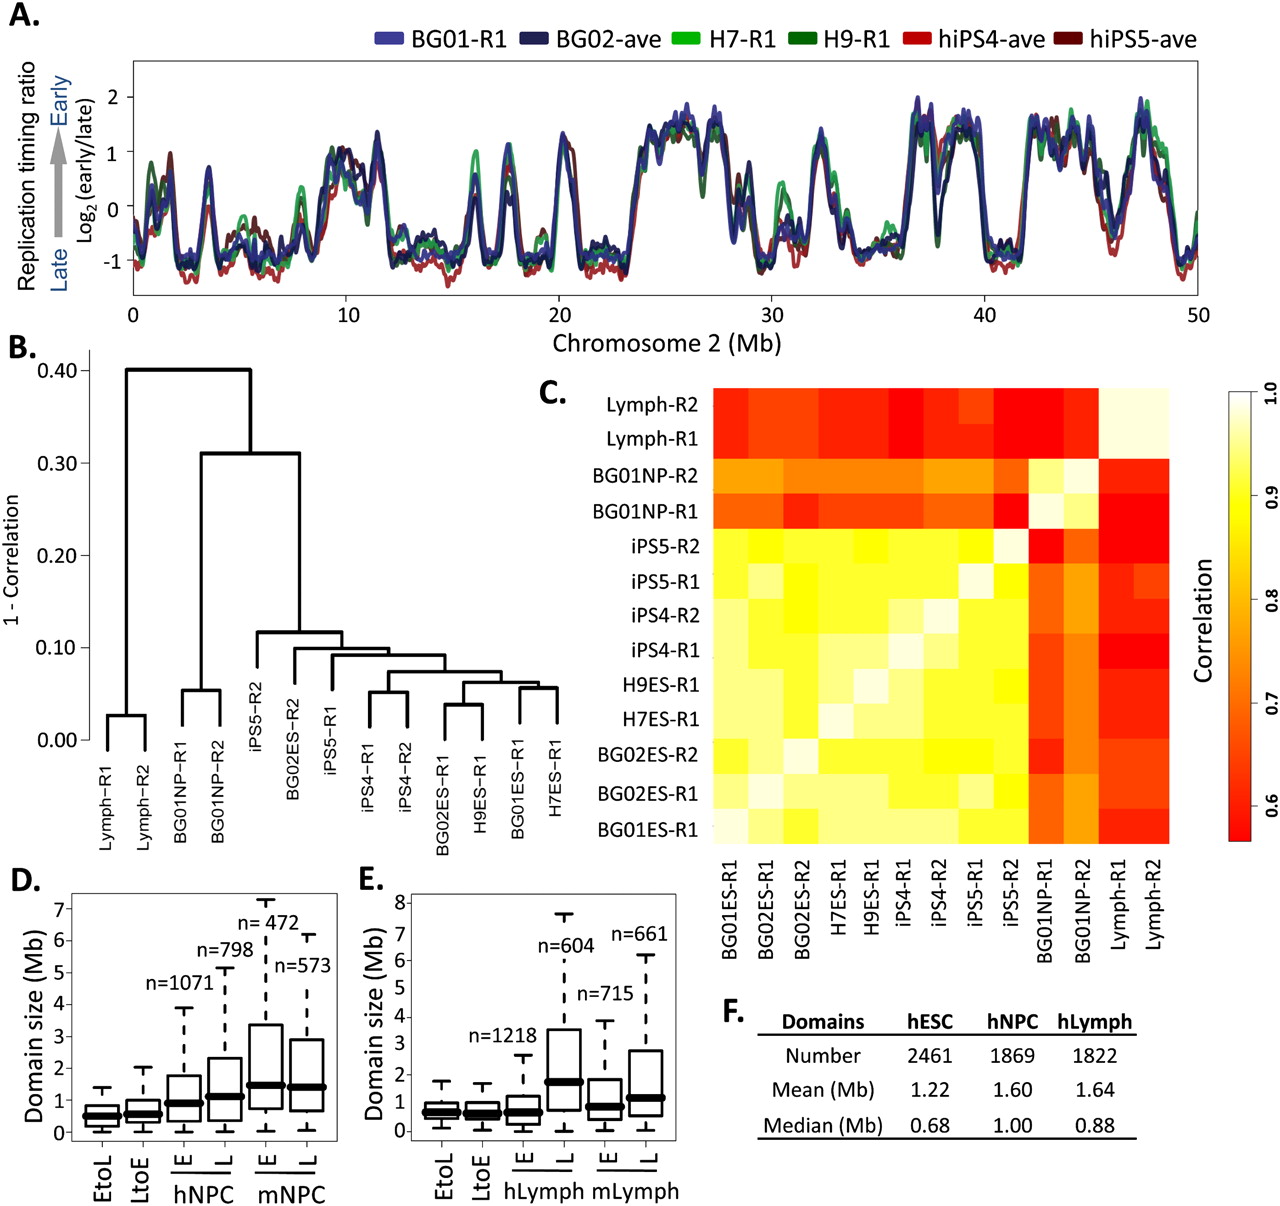
Cell-state specificity of replication profiles. (A) Conservation of replication timing among cell lines BG01, BG02, and H7 shown by loess-smoothed replication profiles generated as in Figure 1. Genome-wide, pairwise Pearson R2 values can be found in Supplemental Figure S3D. (B) Hierarchical clustering of individual RT profile replicates in 12,640 200-kb windows. The height of horizontal bars depicts the relative similarity between clusters, with more similar clusters lower on the graph. (R1) Replicate 1, (R2) replicate 2. (C) Correlation matrix of hESC, hiPSC, hNPC, and lymphoblast replicate profiles averaged in 200-kb windows as in B. Heat map (right) provides a gauge of the relative similarities of data sets to each other. (D,E). Size distribution of EtoL and LtoE switching domains and early vs. late domains in human vs. mouse NPCs (G) and lymphoblasts (H), calculated as in Figure 1B. Data for mNPCs are from Hiratani et al. (2008). (F) Summary of domain numbers and sizes.


