
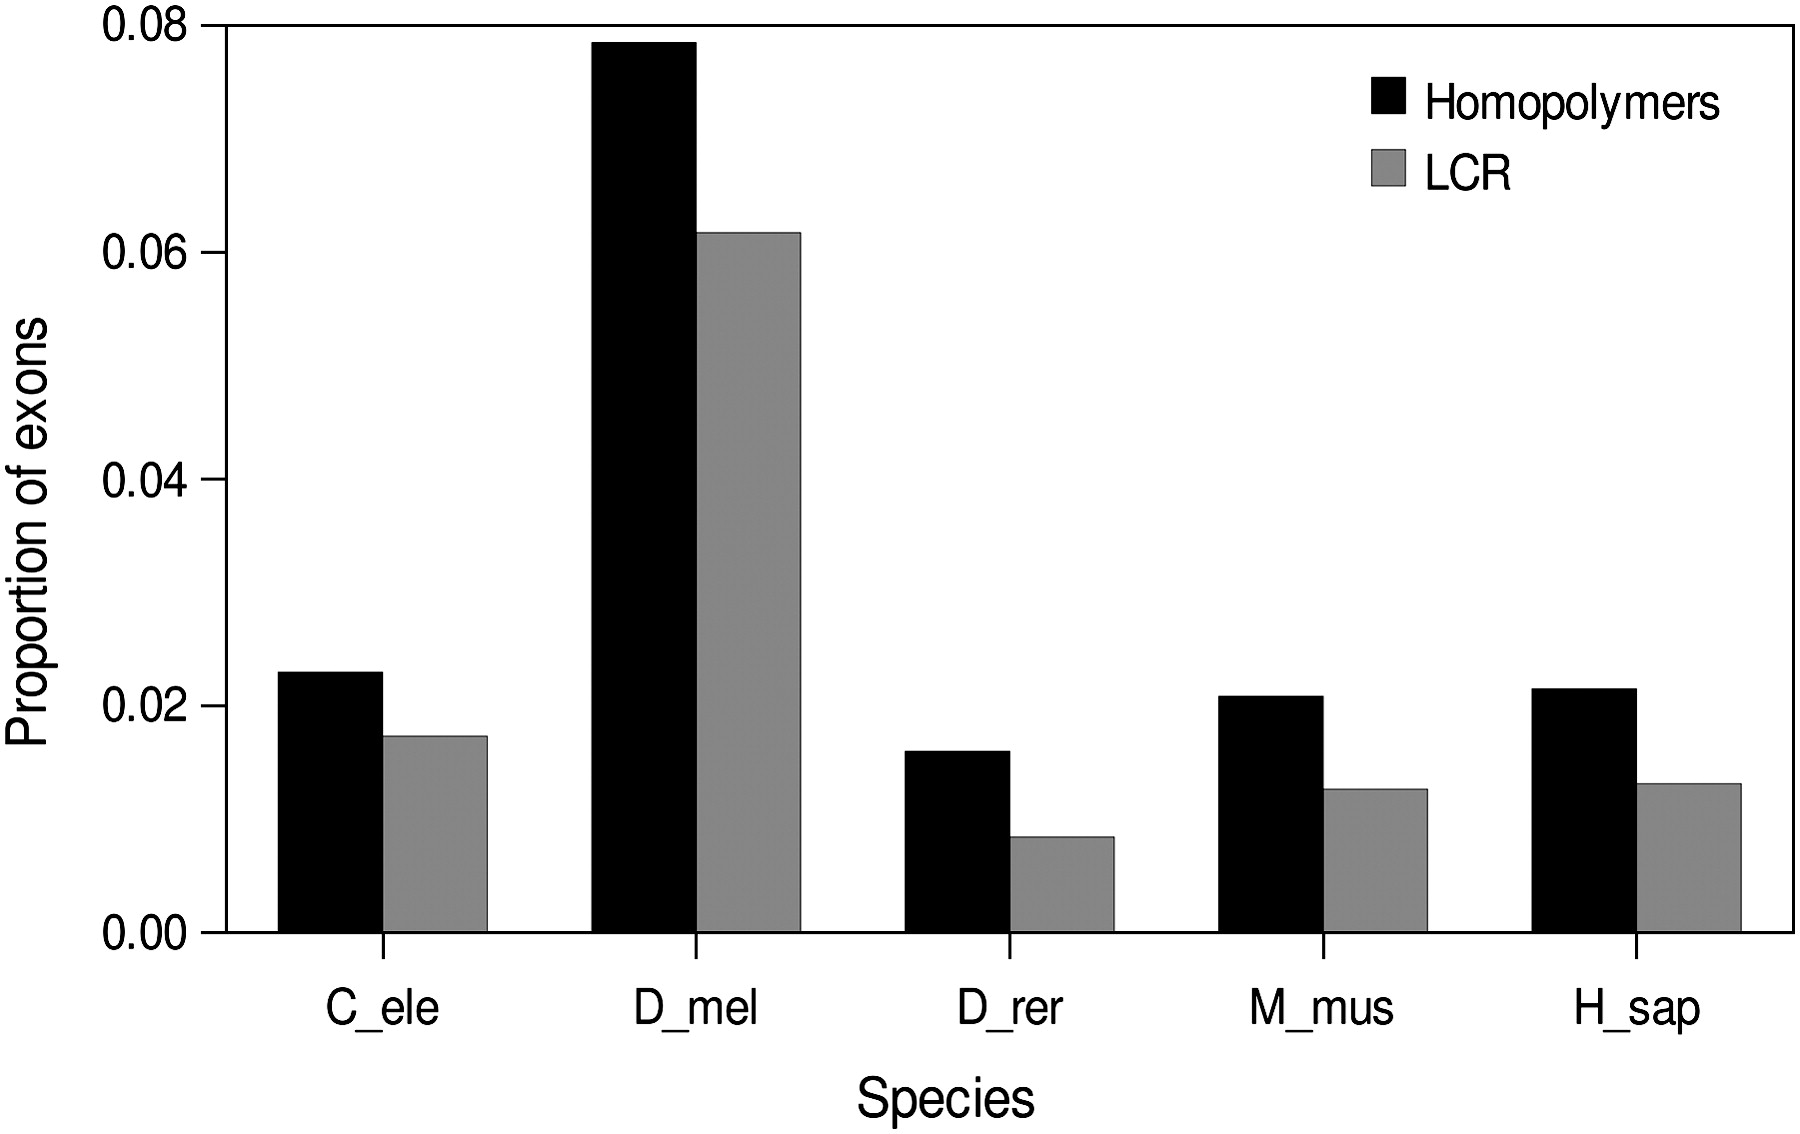
Figure 3.
Proportion of exons with homopolymer sequences (black bars) or low complexity sequences without single amino acid repeats (gray bars) in the C. elegans, D. melanogaster, D. rerio, M. musculus, and H. sapiens genomes.


