
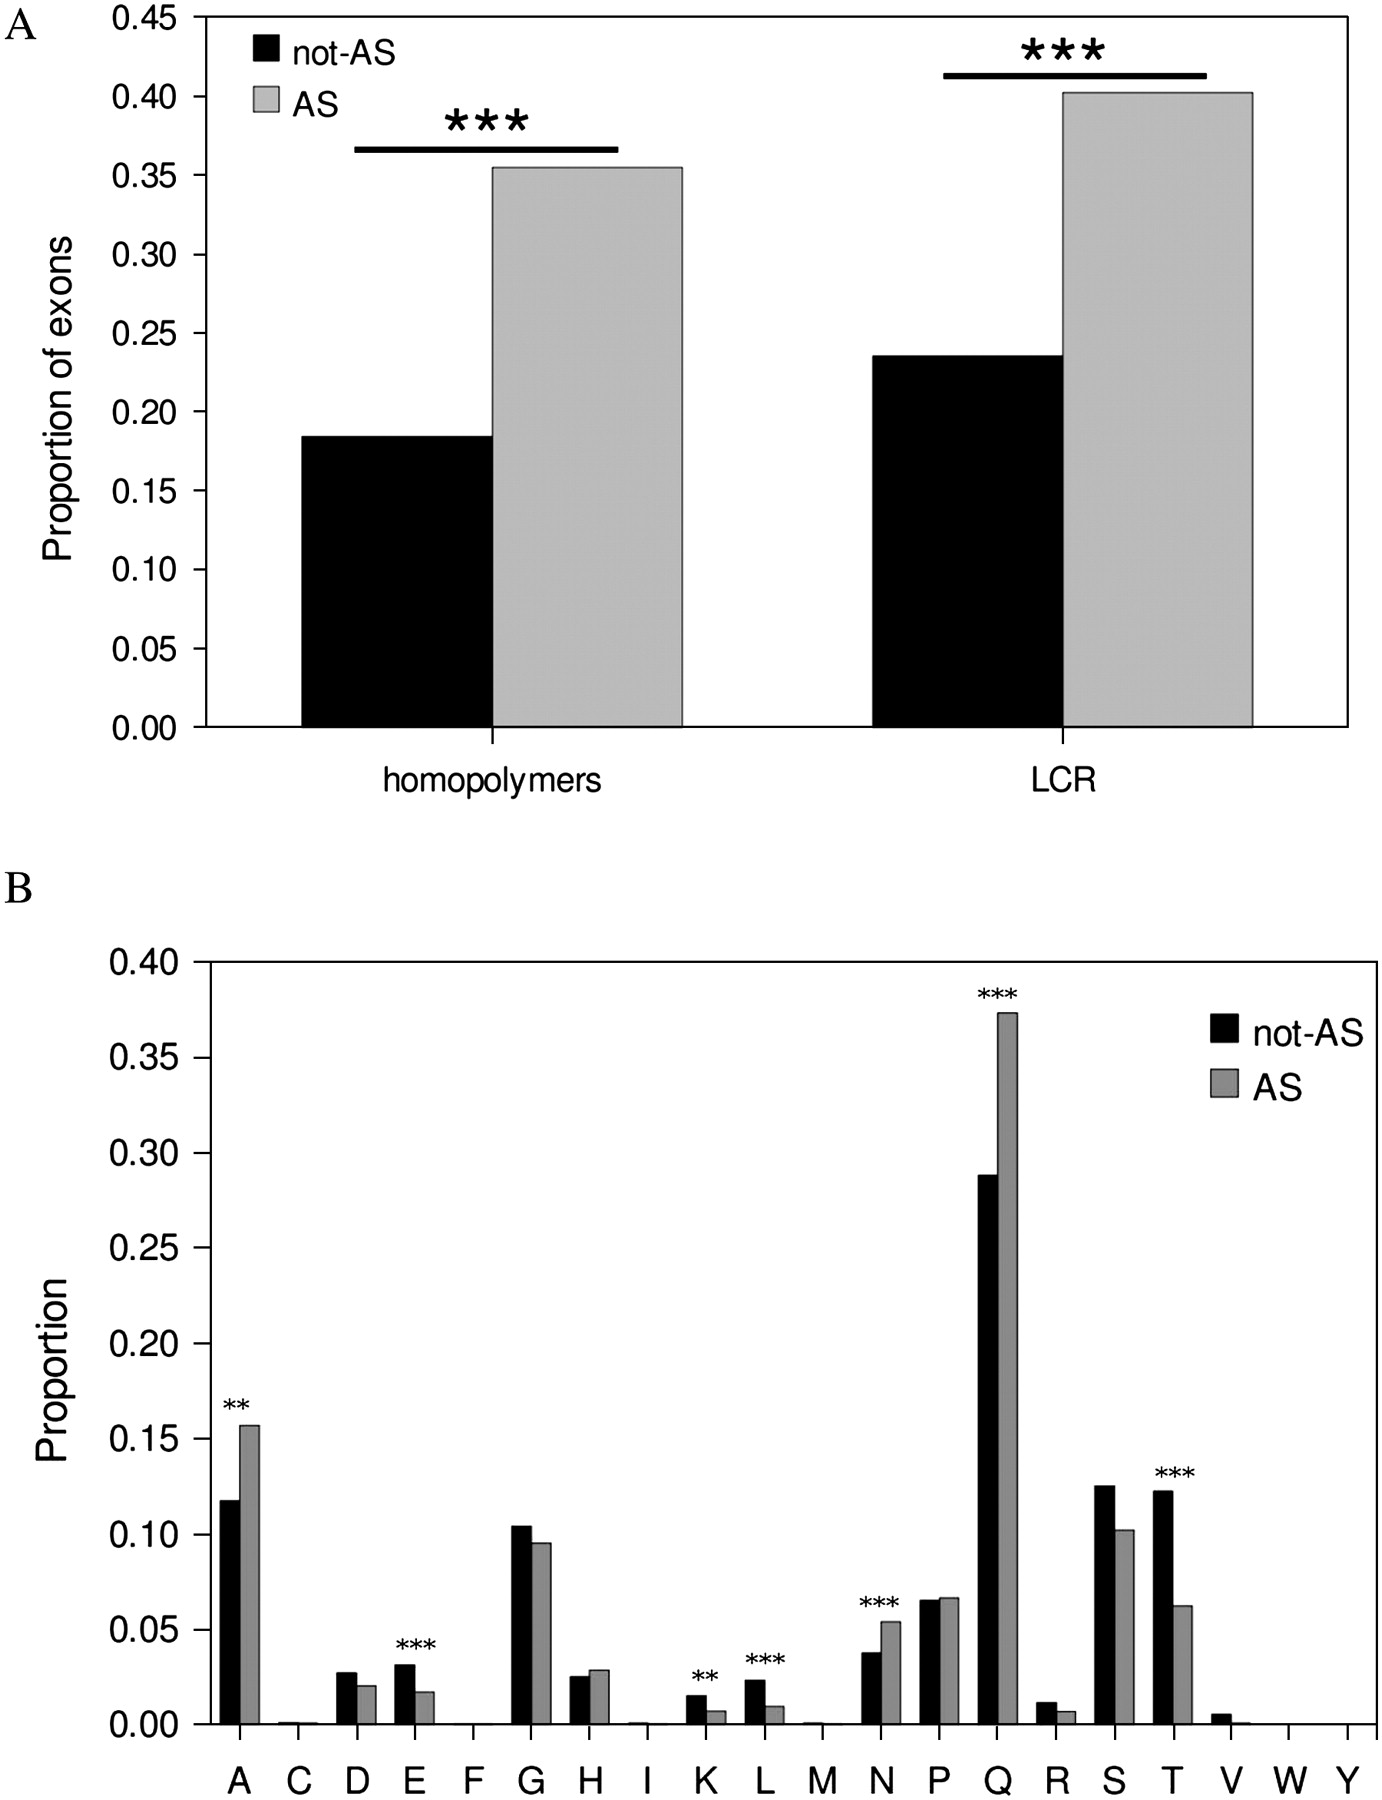
Figure 1.
(A) Proportion of exons found in genes with a single annotated protein isoform (black bars) and in alternatively spliced genes (gray bars) with homopolymer sequences and low complexity protein regions D. melanogaster. (B) Comparison of homopolymer composition between genes undergoing alternative splicing and genes with a single protein isoform. **P < 0.01; ***P < 0.001.


