
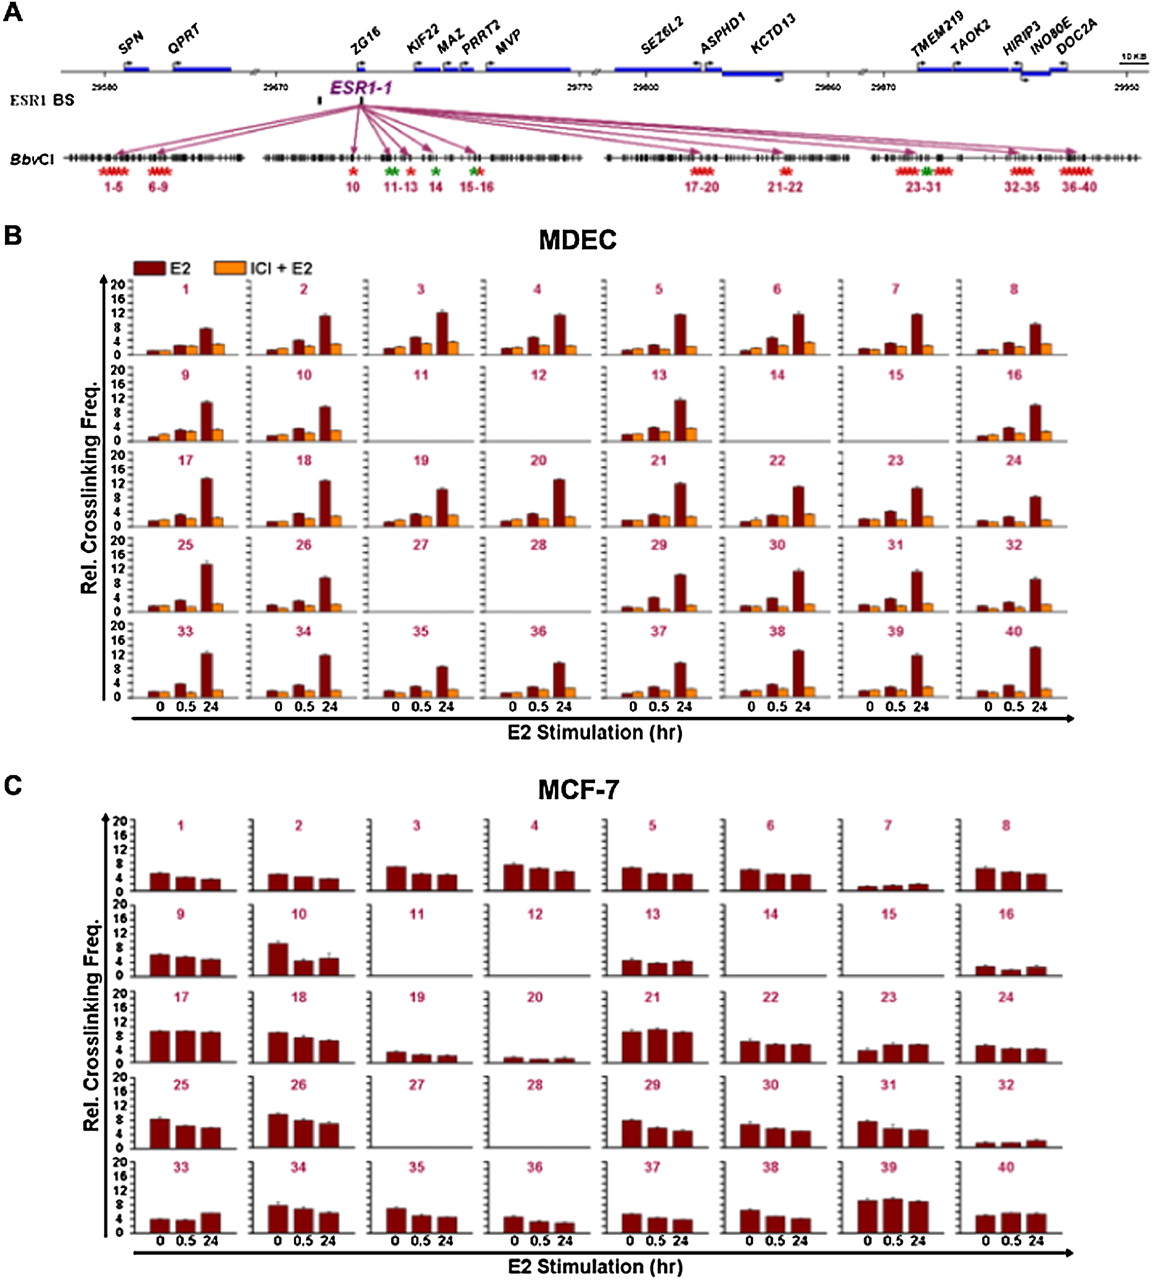
Generation of ESR1-1-mediated DNA loops in the 16p11.2 gene cluster. (A) Diagram of a genomic region surveyed by chromatin conformation capture (3C)-qPCR assays. Forty reactions (number in violet) of 3C-qPCR were performed in BbvCI-digested DNA samples. Areas (red) selected for 3C-qPCR were frequently localized at the 5′-ends of genes. Inter- and intragenic regions (green) were also selected as negative controls for the assay. (B) Formation of DNA loops at ESR1-1 upon E2 stimulation in normal cells. In the presence of E2, MDECs were treated without (E2) or with (E2+ICI) the ESR1 antagonist, ICI182780 (ICI, 1 μM) for two time-periods (0.5 and 24 h). BbvCI-digested DNA fragments were subjected to 3C-qPCR. Data are shown in relative cross-linking frequencies compared with that of GAPDH as an internal control. Mean ±SD (n = 3). (C) Formation of DNA loops at ESR1-1 in breast cancer cells. BbvCI-digested DNA fragments from E2-stimulated MCF-7 cells (0.5 and 24 h) were subjected to 3C-qPCR. Data are shown in relative cross-linking frequencies compared with that of GAPDH as an internal control. Mean ±SD (n = 3).


