
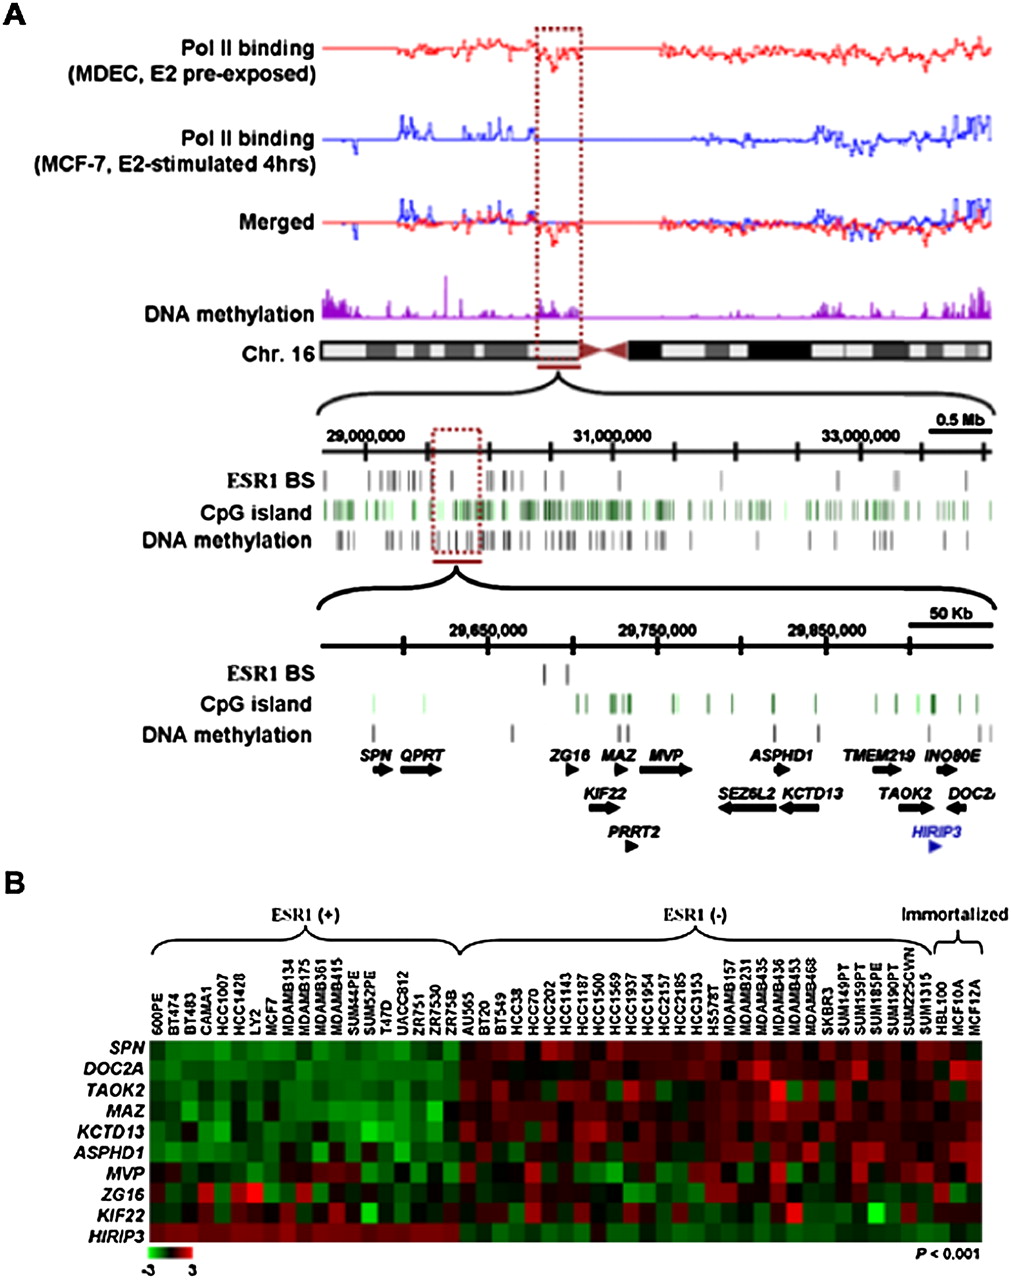
Concurrent silencing of a gene cluster on chromosome 16p11.2. (A) Representative example of a repressive gene cluster (black, n = 14) on chromosome 16p11.2 identified through integrative mapping. Within this gene cluster, HIRIP3 (blue) was found to be positively regulated by ESR1. The expression of this gene was used as a positive control for the study. (B) In silico expression analysis of the 16p11.2 cluster in 48 breast cancer cell lines. Microarray expression data (Neve et al. 2006) of nine of the 14 genes were available for the construction of a heat map as shown. Statistical analysis used to distinguish ESR1-positive from ESR1-negative breast cancer cell lines was calculated by Wilcoxon rank sum test.


