
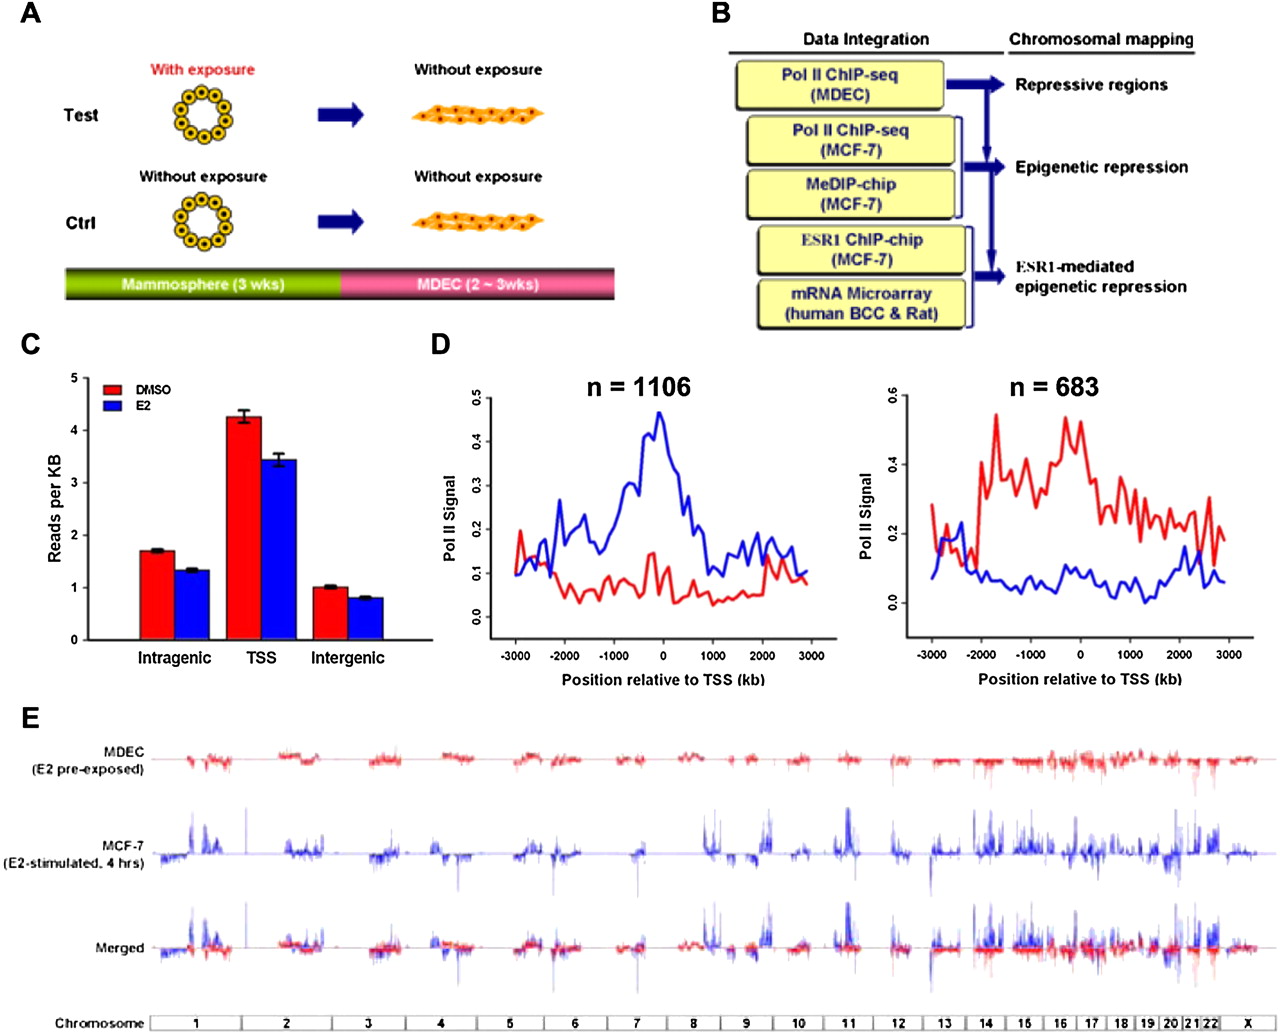
Integrative mapping of large genomic zones subject to estrogen-mediated epigenetic repression. (A) Experimental scheme. Progenitor cells, propagated into floating mammospheres, were exposed to different estrogenic compounds for 3 wk. Upon the removal of these compounds, cells were induced to epithelial differentiation on two-dimensional collagen substratum for 2∼3 wk. The differentiated progeny, called mammosphere-derived epithelial cells (MDECs), were used for ChIP-seq analysis. (B) Flowchart showing step-wide identifications of chromosomal regions associated with ESR1-mediated repression. Omics data, including ChIP-seq for differential RNA polymerase II (Pol II) binding sites and MeDIP-chip for DNA methylation profiling, were acquired for identifying the epigenetically repressed regions in the human genome. ChIP-chip and expression microarray data collected from published information were coupled with omics data to identify the ESR1-mediated repressive regions. (C) Genome-wide distribution of Pol II binding sites in the human genome. After 3 wk of E2 or DMSO pre-exposure, MDECs were subjected to ChIP-seq with Pol II antibody. The binding locations of Pol II were categorized into three groups, intragenic area, regions closed to transcription start sites (TSS), and intergenic region. Gene definitions were taken from the UCSC Genome Browser's RefGene table (Pruitt et al. 2007; Karolchik et al. 2008). For genes with more than one isoform, all TSSs were considered, but intragenic region measurements were taken from the longest isoform of the gene (less TSS regions). (D) Distribution of differential expressed genes regulated by E2 in MDECs. Cutoffs for Pol II activity were determined by examining levels of enrichment within known housekeeping genes and choosing the lower fifth percentile (Eisenberg and Levanon 2003). Similarly, cutoffs for lack of binding activity were established by studying enrichment values from gene desert regions. Comparing the E2-pretreated and control mammosphere populations, we found 1106 activated (left) and 683 repressed (right) genes upon E2 treatment. (E) Genome-wide sound-track of differential gene expression in response to E2 treatment in human normal and malignant cells. ChIP-seq with Pol II antibody was conducted on E2-treated MDECs (red track) and MCF-7 cells (blue track).


