
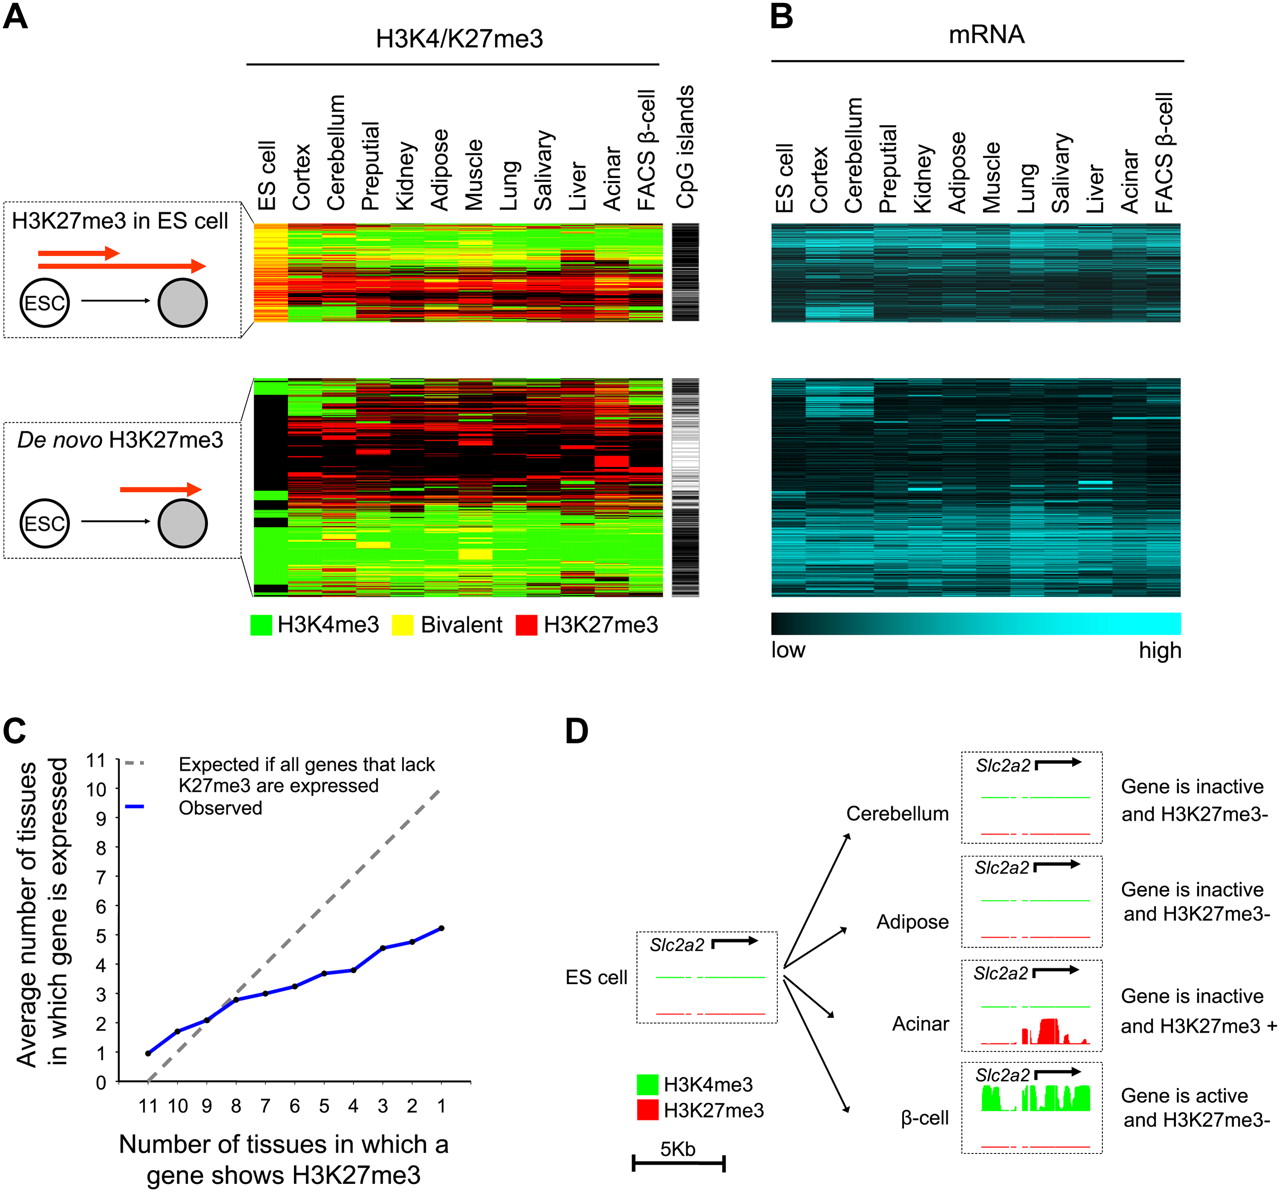
Tissue-specific loss and gain of H3K27 methylation. (A) Although many genes that show H3K27me3 enrichment in differentiated cells are also H3K27me3+ in ES cells, unexpectedly 69% of genes only show H3K27me3 enrichment in differentiated tissues (de novo H3K27me3). The cluster representation shows H3K27me3 (red), H3K4me3 (green), or both (yellow) in the 5248 genes that show H3K27me3 in at least one tissue. Genes with de novo H3K27me3 often lack CpG islands, which are indicated as a black line. (B) Most genes with H3K27me3 are inactive (see also Supplemental Fig. S2d). The mRNA heatmap maintains the same order as A. (C,D) H3K27me3 repression is both gene-specific and cell-specific. (C) Genes that are targeted by H3K27me3 in only few tissues are often also inactive in tissues where they do not show H3K27me3. This effect was more pronounced for non-CpG island genes (Supplemental Fig. S2c). (D) The beta-cell glucose transporter Slc2a2 shows H3K27me3 enrichment in acinar cells, yet is inactive in other tissues that lack H3K27me3. The graph shows posterior probability values ranging from 0–1 for the enrichment of H3K4me3 (green) and H3K27me3 (red).


