
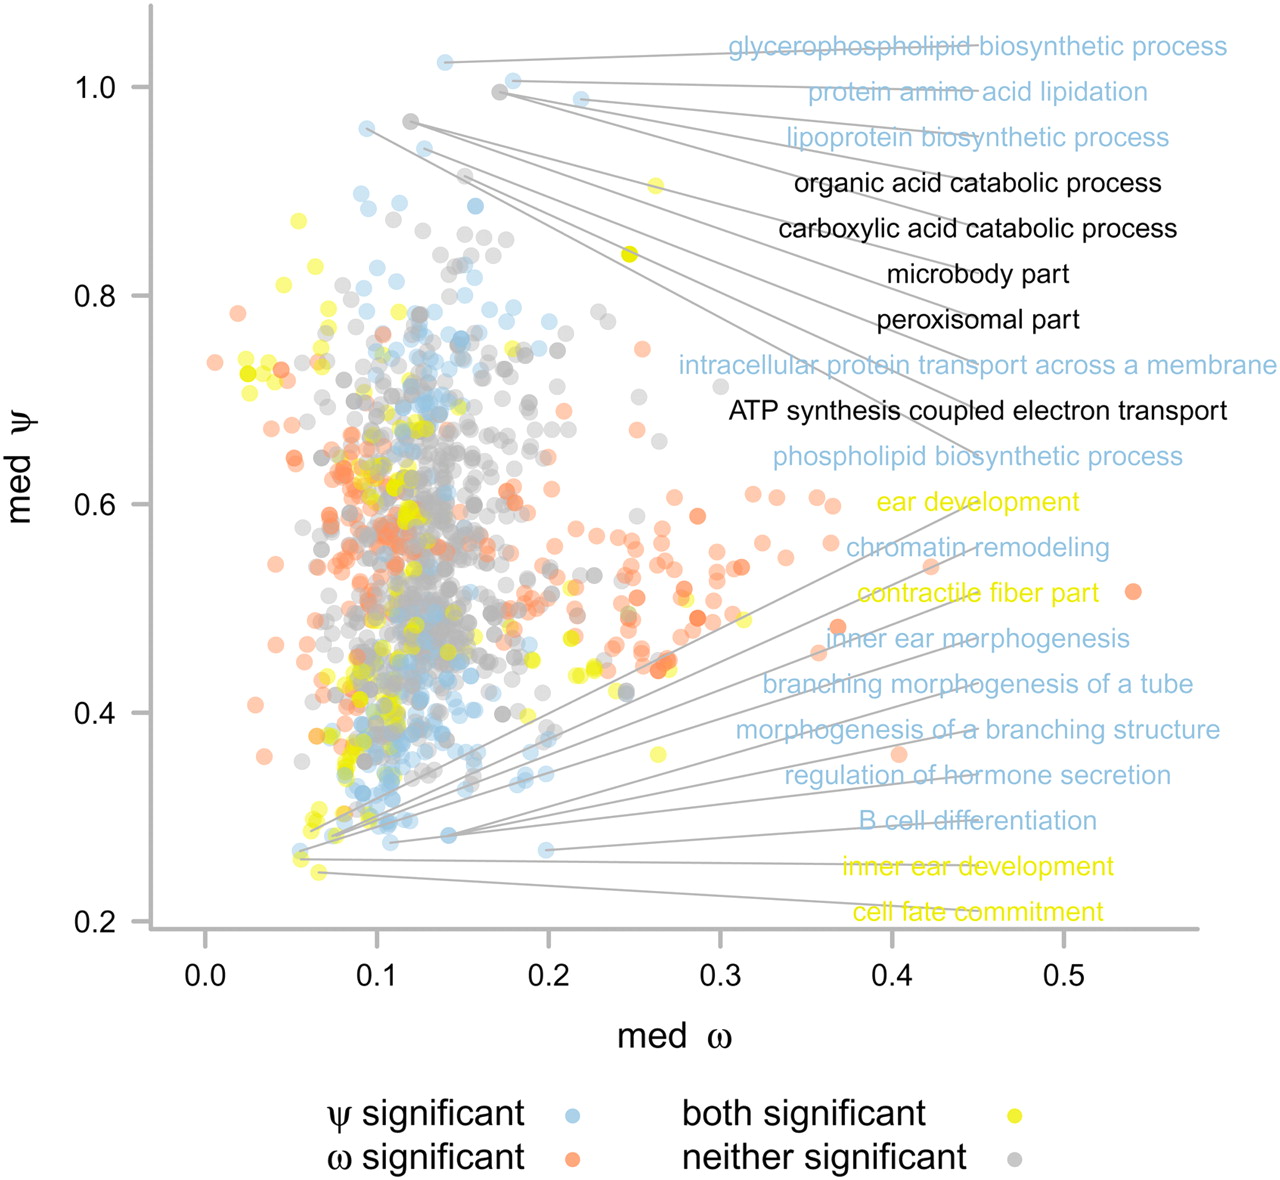
Figure 5.
Scatter plot of median ψ = dT/dS versus median ω = dN/dS for the genes in 1402 GO terms. Only terms that are annotated on at least 15 genes are shown. The term has a significantly high or low value of ψ (blue), ω (red), both measurements (yellow), or neither measurement (gray), as determined by FDR threshold q < 0.05. Labels indicate the terms with the 10 highest and 10 lowest ψ values.


