
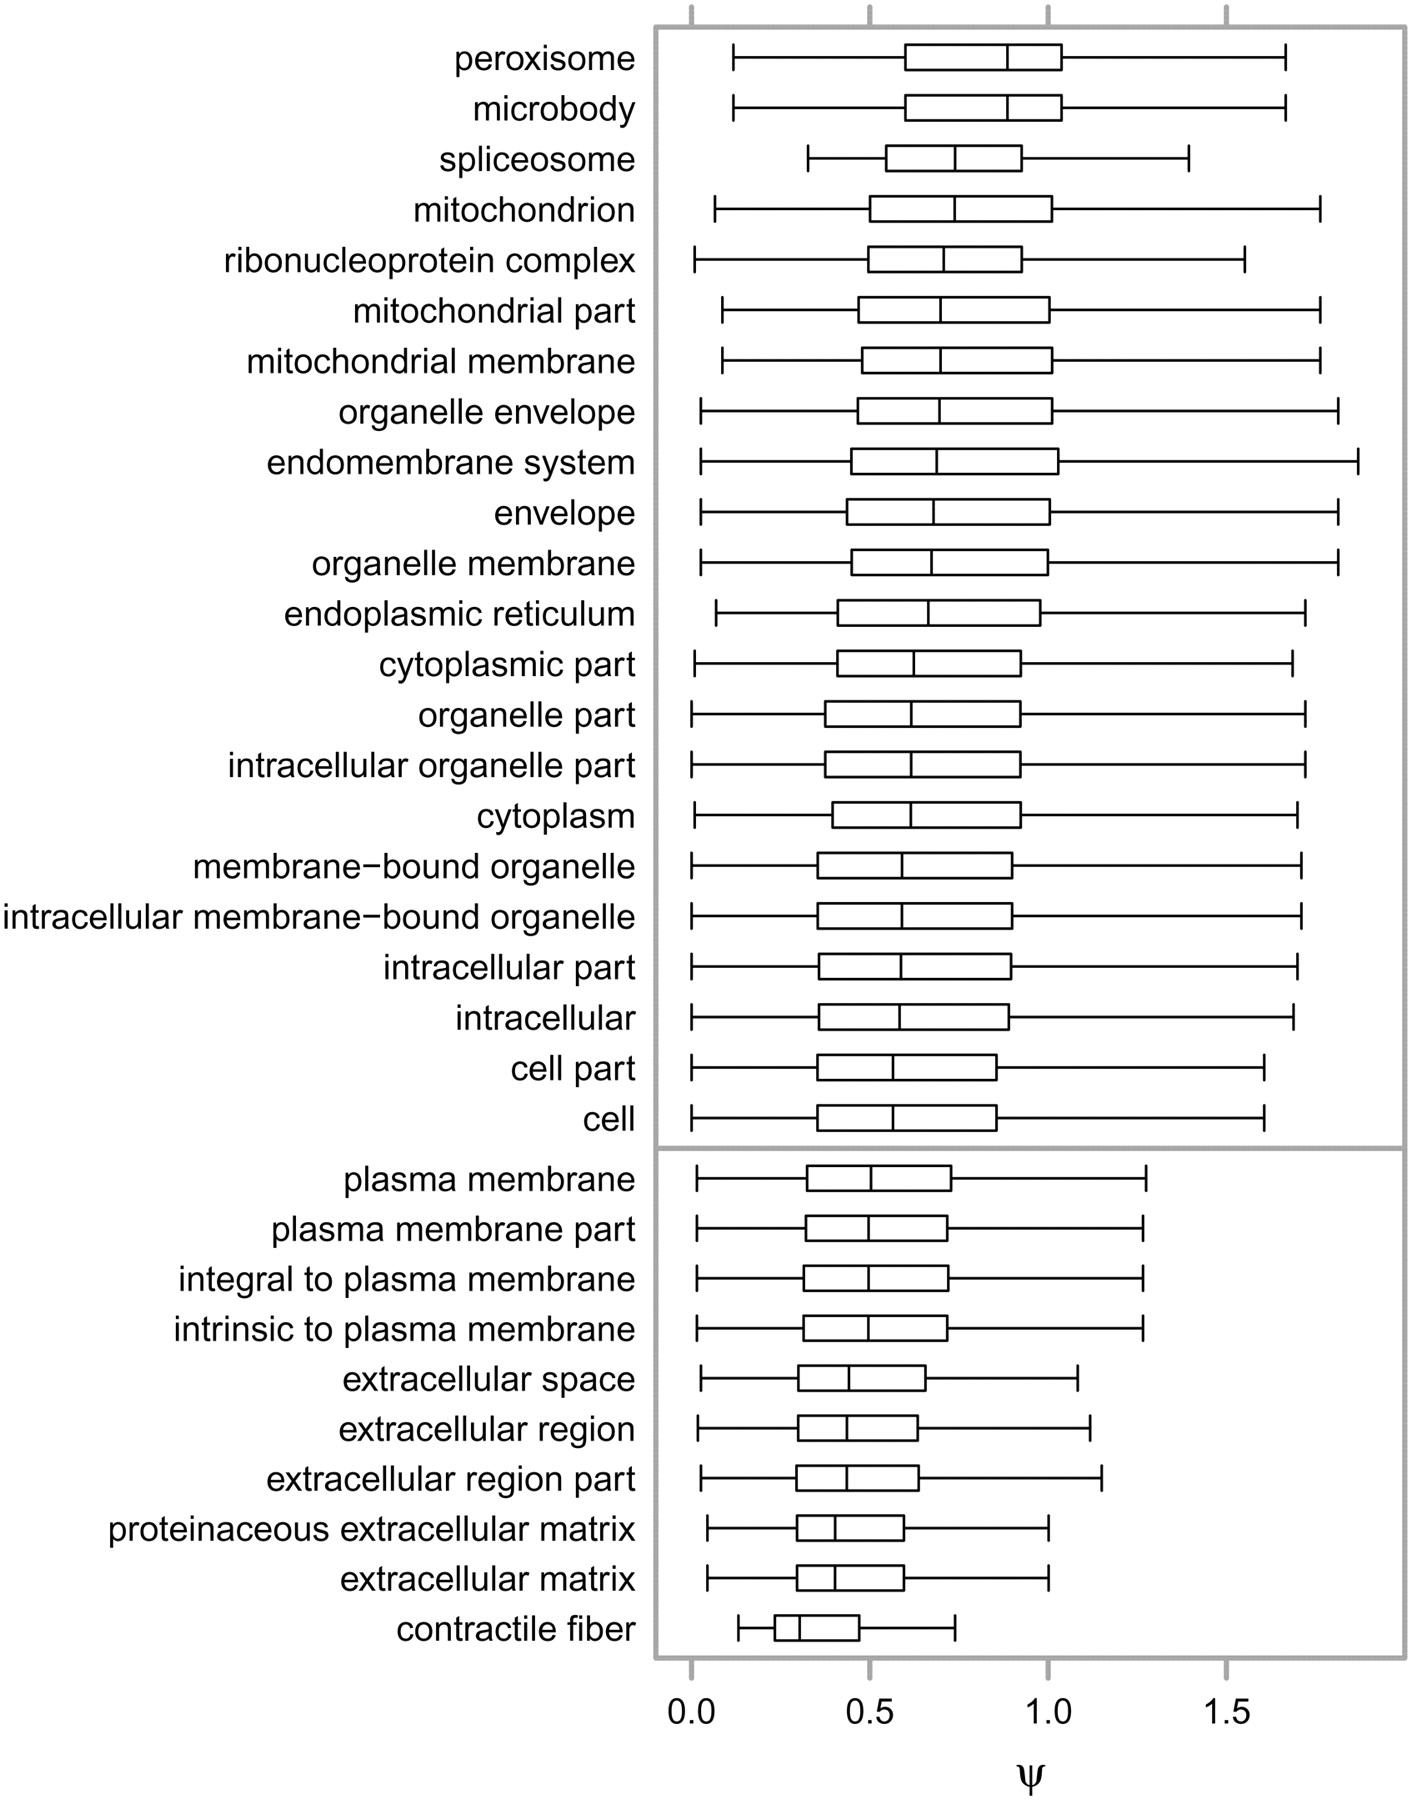
Figure 4.
Box plot of ψ = dT/dS values arranged by GO cellular component term, for each term associated with significantly high (above dividing line) or low (below dividing line) ψ values, as determined by the Wilcoxon rank sum test (P < 1 × 10⁻⁴) performed by FUNC (see Methods). The vertical bar in each box indicates the median ψ, the extents of each box the first and third quartiles of ψ, and the whiskers extend to the furthest data point that is no more than 1.5 times the interquartile range from the nearest quartile. High outliers are used in calculating statistics, but are omitted from the display for clarity.


