
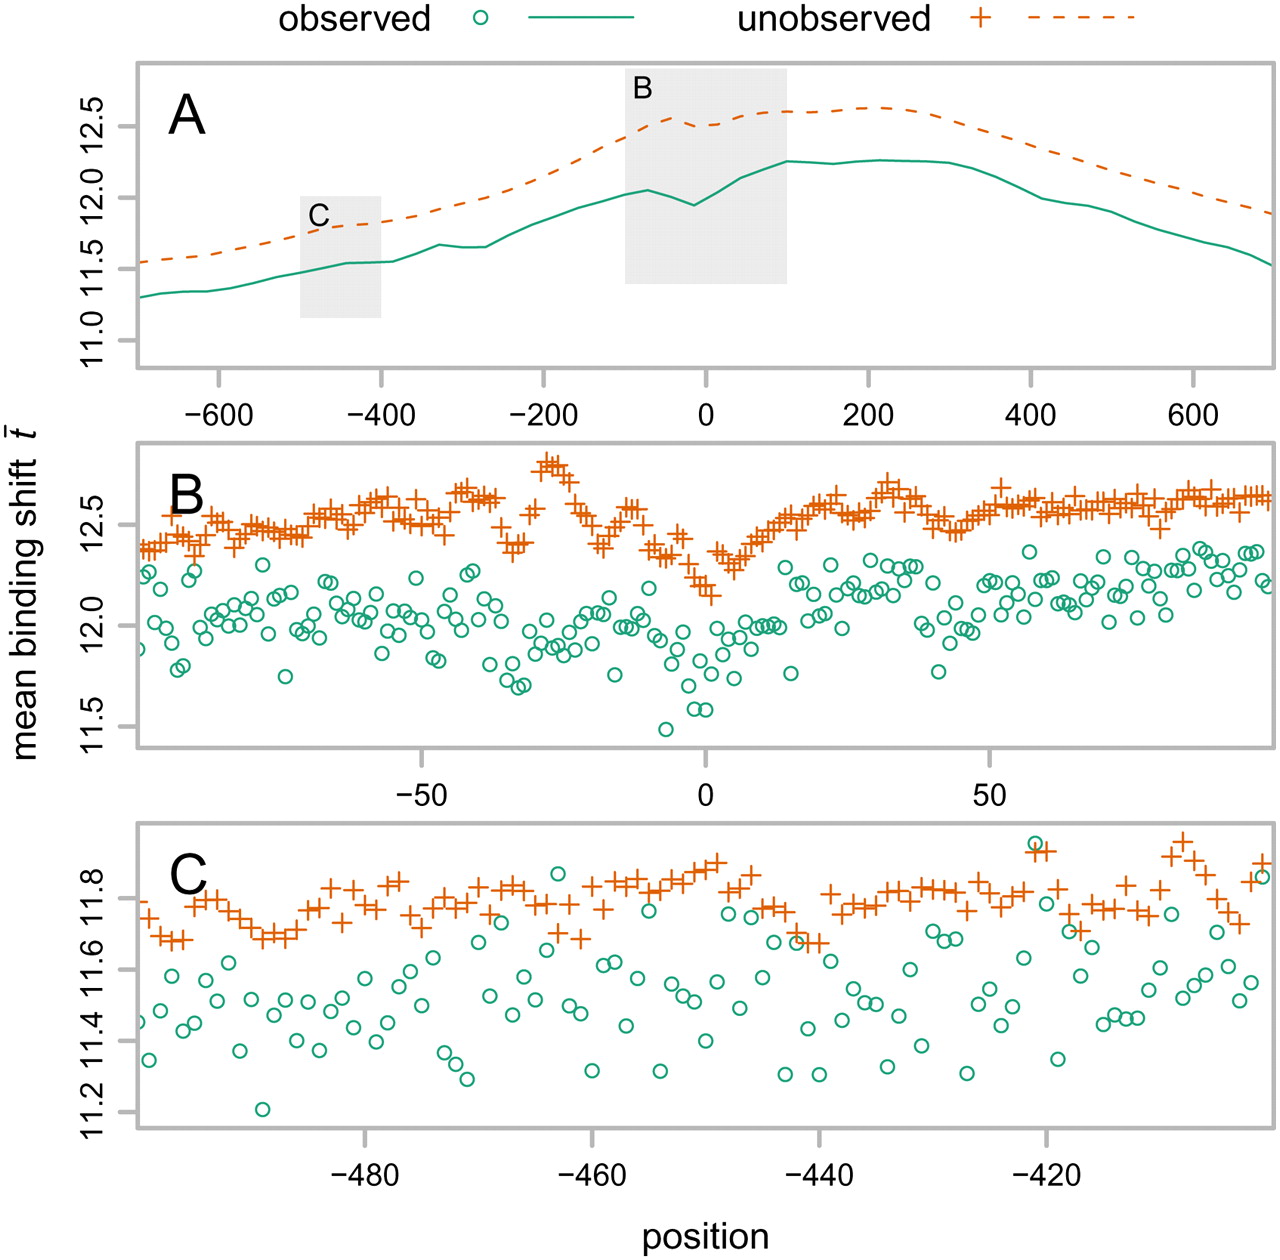
Figure 3.
Aggregation plot of the binding shifts of 17,600 human genes, averaged within two groups: one where the simulated mutation was observed in dog (green circles, solid line), and one where it was unobserved (orange crosses, dashed line). (A) Local regressions for ±700 bp around the TSS, estimated with the loess (Cleveland and Devlin 1988) function in R (R Development Core Team 2007), with second-degree polynomials and α = 0.1. Shaded regions in this plot are magnified as separate panels below to show mean binding shifts at individual positions proximal to (B) and more distal from (C) the TSS.


