
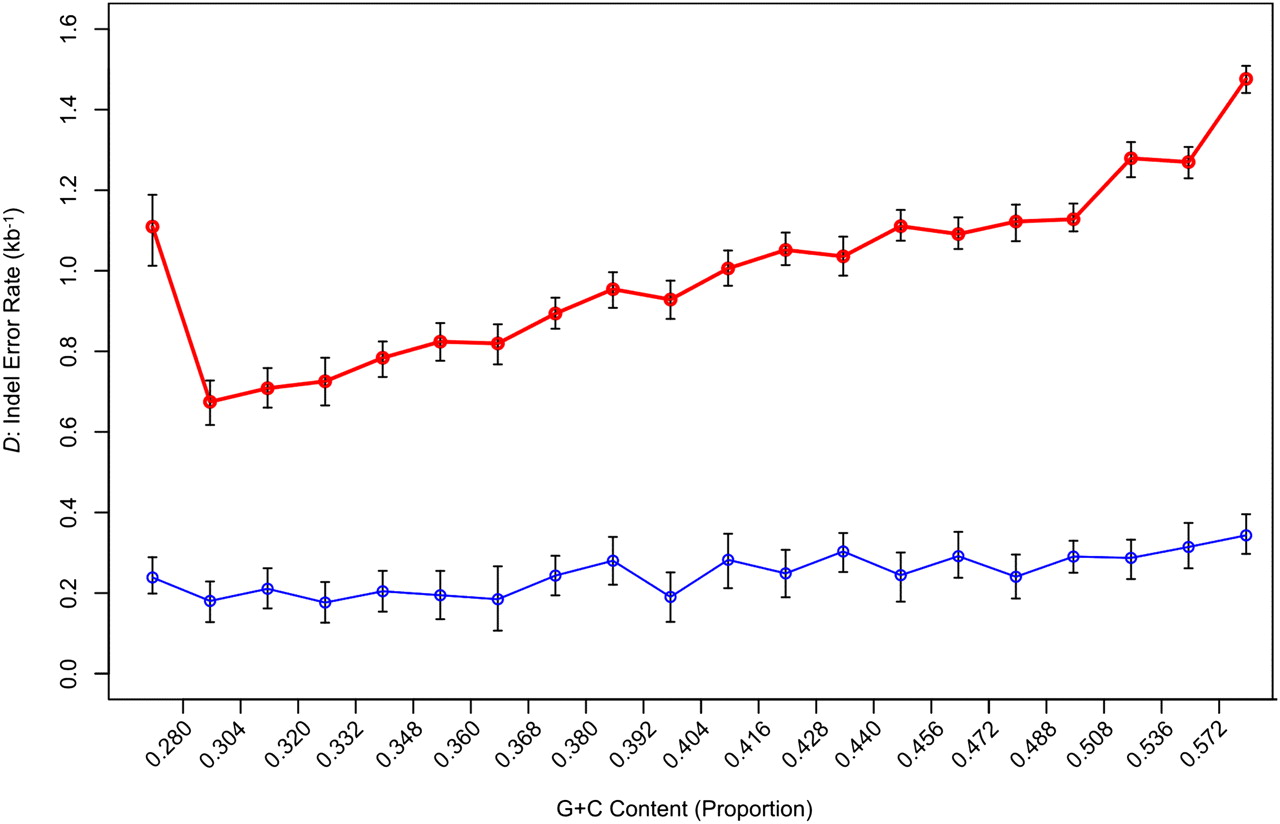
Density of gaps that are errors partitioned by genomic G+C content. The y-axis represents the density of indel errors (D) in alignments of nonrepetitive sequence between the human and Sumatran orangutan genome assemblies (red) and the human and Bornean orangutan assembly (blue). Error bars, 95% confidence intervals for the estimation of D, as determined against the neutral indel model calibrated on the frequency of IGS lengths ∼150–300 bp. In the original Sumatran orangutan–human alignments, D appears to be dependent on the G+C content of the sequence, with more anomalous gaps located in G+C-rich regions. D has been significantly reduced in the Bornean genome build, while the estimated per-site probabilities of true indel mutations are comparable to those calculated using the Sumatran genome. As a result, the correlation between G+C and D is less prominent in our build of the Bornean orangutan genome assembly, with a relatively even distribution of gap errors across the 20 G+C bins.


