
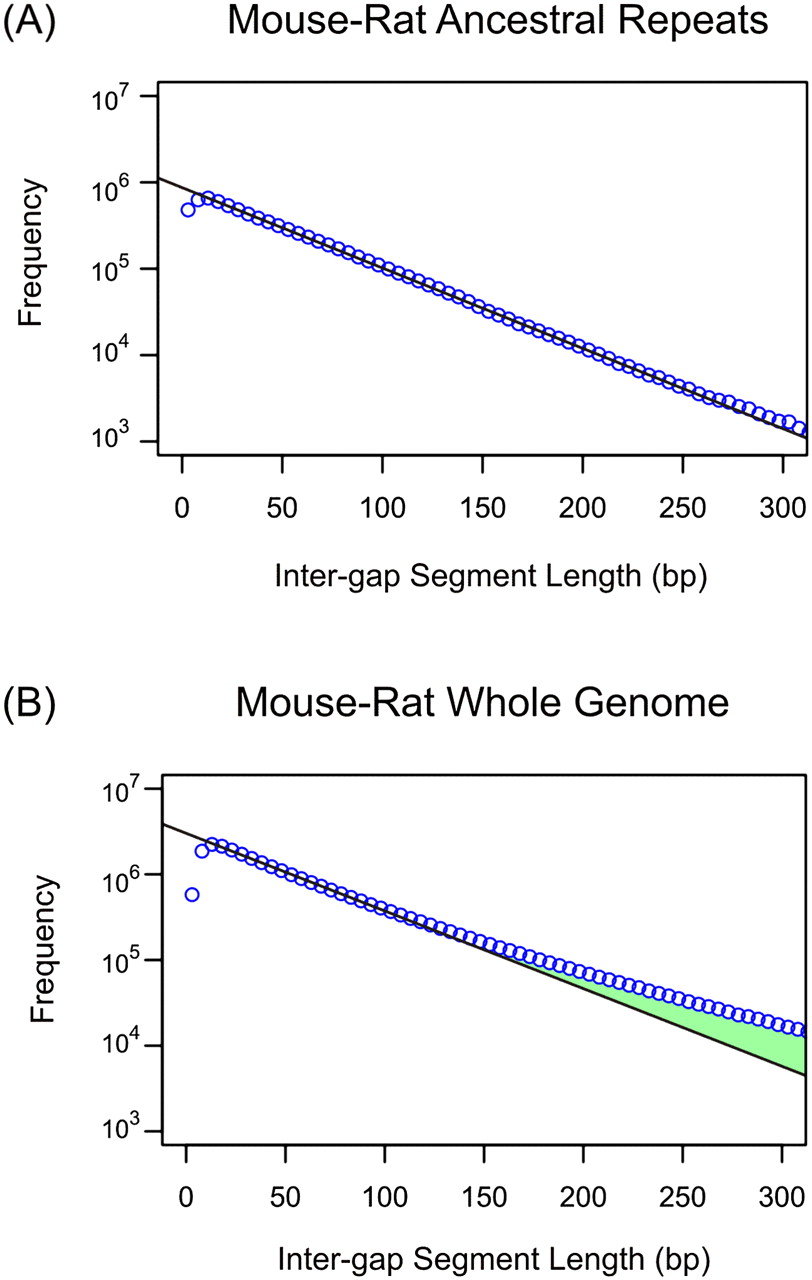
Genomic distribution of intergap segment lengths in mouse-rat alignments for ancestral repeats (A) and whole-genome sequences (B). Frequencies of IGS lengths are shown on a natural log scale. The black line represents the prediction of the neutral indel model, a geometric distribution of IGS lengths; observed counts (blue circles) are accumulated in 5 bp bins of IGS lengths. Within mouse-rate ancestral repeat sequence, the observations fit the model accurately for IGS between 10 bp and 300 bp. For whole-genome data, a similarly close fit is observed for IGS between 10 bp and 100 bp. Beyond 100 bp, an excess of longer IGSs (green) above the quantities predicted by the neutral indel model can be observed, representing functional sequence that has been conserved with regards to indel mutations. The depletion of short (<10 bp) IGS reflects a “gap attraction” phenomenon (Lunter et al. 2008).


