
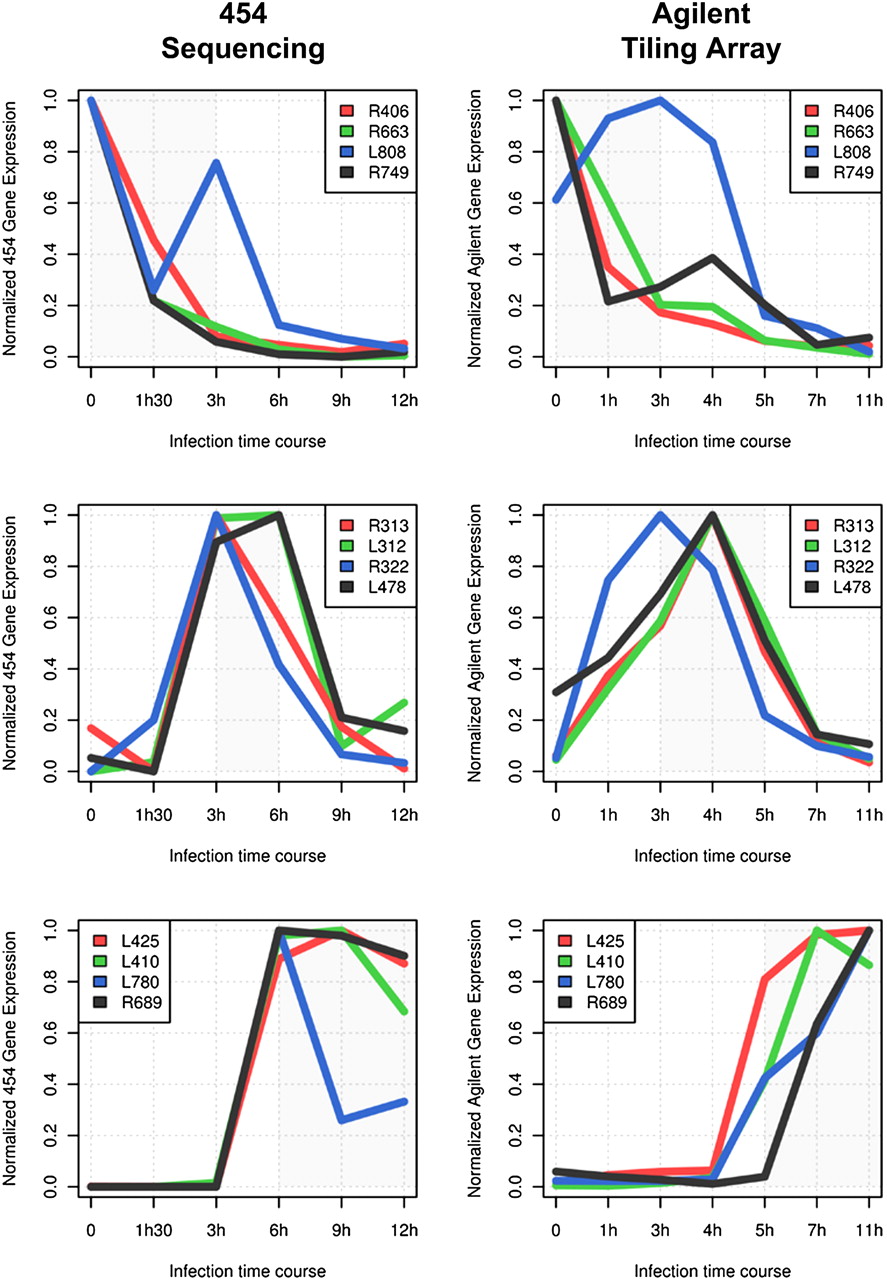
Figure 5.
Variability of individual expression profiles. Normalized gene expression profiles are plotted for representative genes from the three main transcript classes (from top to bottom): genes belonging to the “early” class, the “intermediate” class, and the “late” class. The area of highest expression for each class is highlighted in gray (Fig. 4B, red). The expression data obtained from Agilent tiling array experiments are in good agreement with the RNA-seq expression profiles. The absolute number or reads for RNA-seq experiment are shown in Supplemental Fig. S8.


