
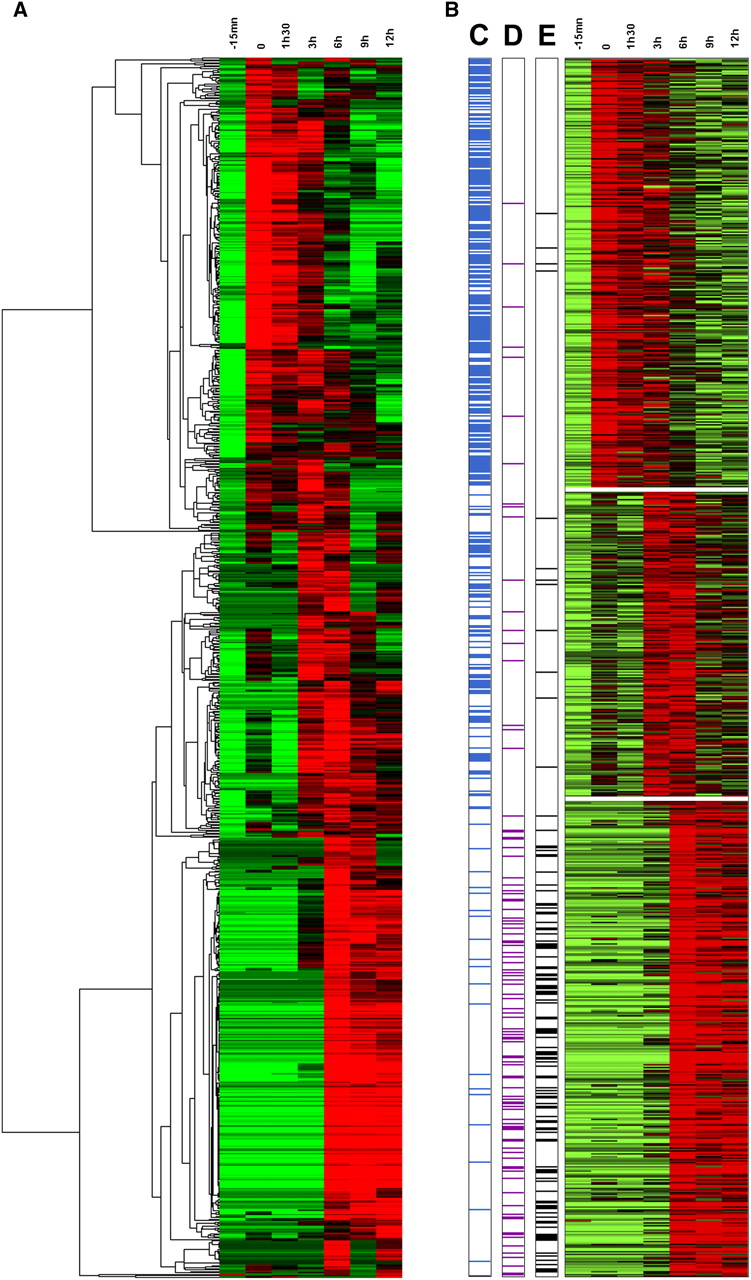
Main Mimivirus gene expression classes. (A) Heat map of Mimivirus gene expression profiles. Rows correspond to the 841 analyzed genes and columns to the seven infection time points. Expression intensities are displayed from green (low expression) to red (high expression). Expression profiles are clustered using hierarchical clustering (see Methods for details). A dendrogram of the clustering is shown on the left. (B) Heat map of the same expression profiles partitioned into three main classes, “early” (top), “intermediate” (center), and “late” (bottom), by k-means clustering algorithm (see Methods for details). (C) Presence (blue lines) of the AAAATTGA “early” promoter element in the 5′ gene regulatory region; (D) presence (purple lines) of the “late” promoter element (see main text); (E) transcripts corresponding to gene products previously identified in the virus particle proteome (black lines).


