
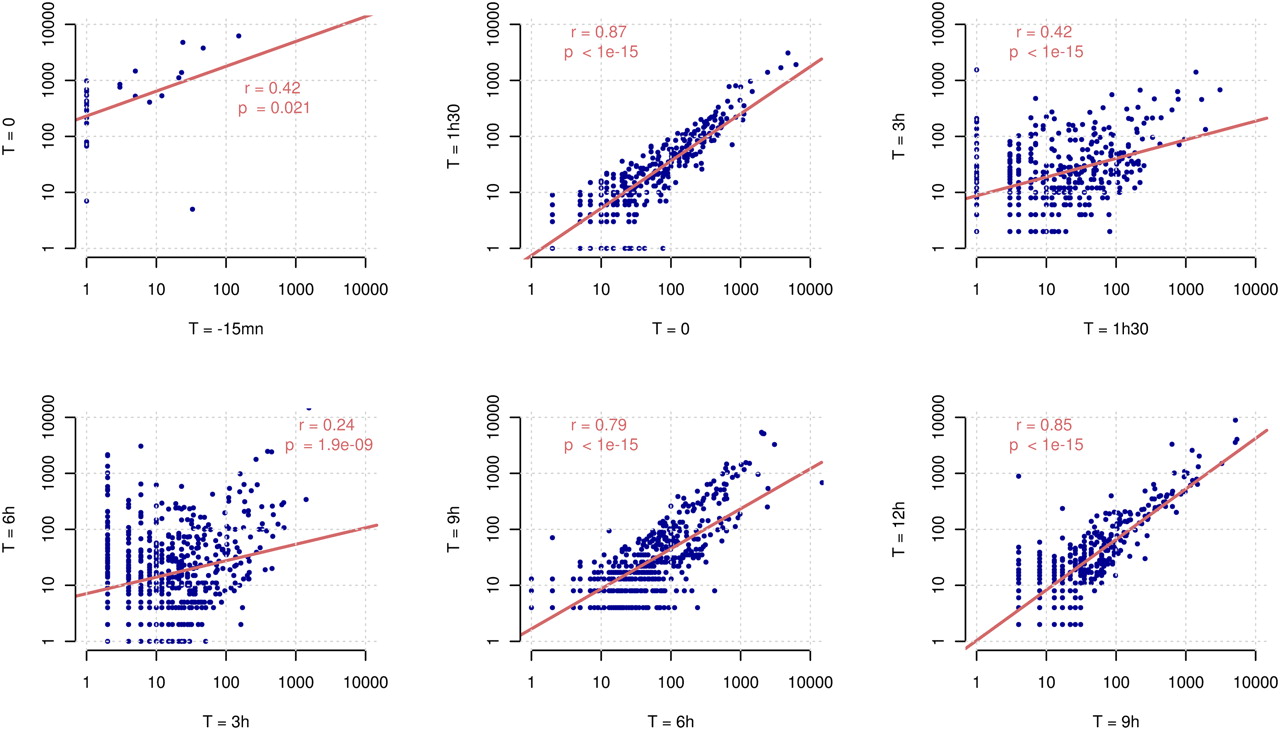
Figure 3.
Pairwise comparison of expression profiles between successive time points. Gene expression is measured in normalized read counts. The scatter plots show the expression of genes (blue points) between successive time points during the infection from early phases (top left) to late phases (bottom right). Linear regressions on the log-transformed values, as well as the correlation coefficients and P-values, are shown on each graph.


