
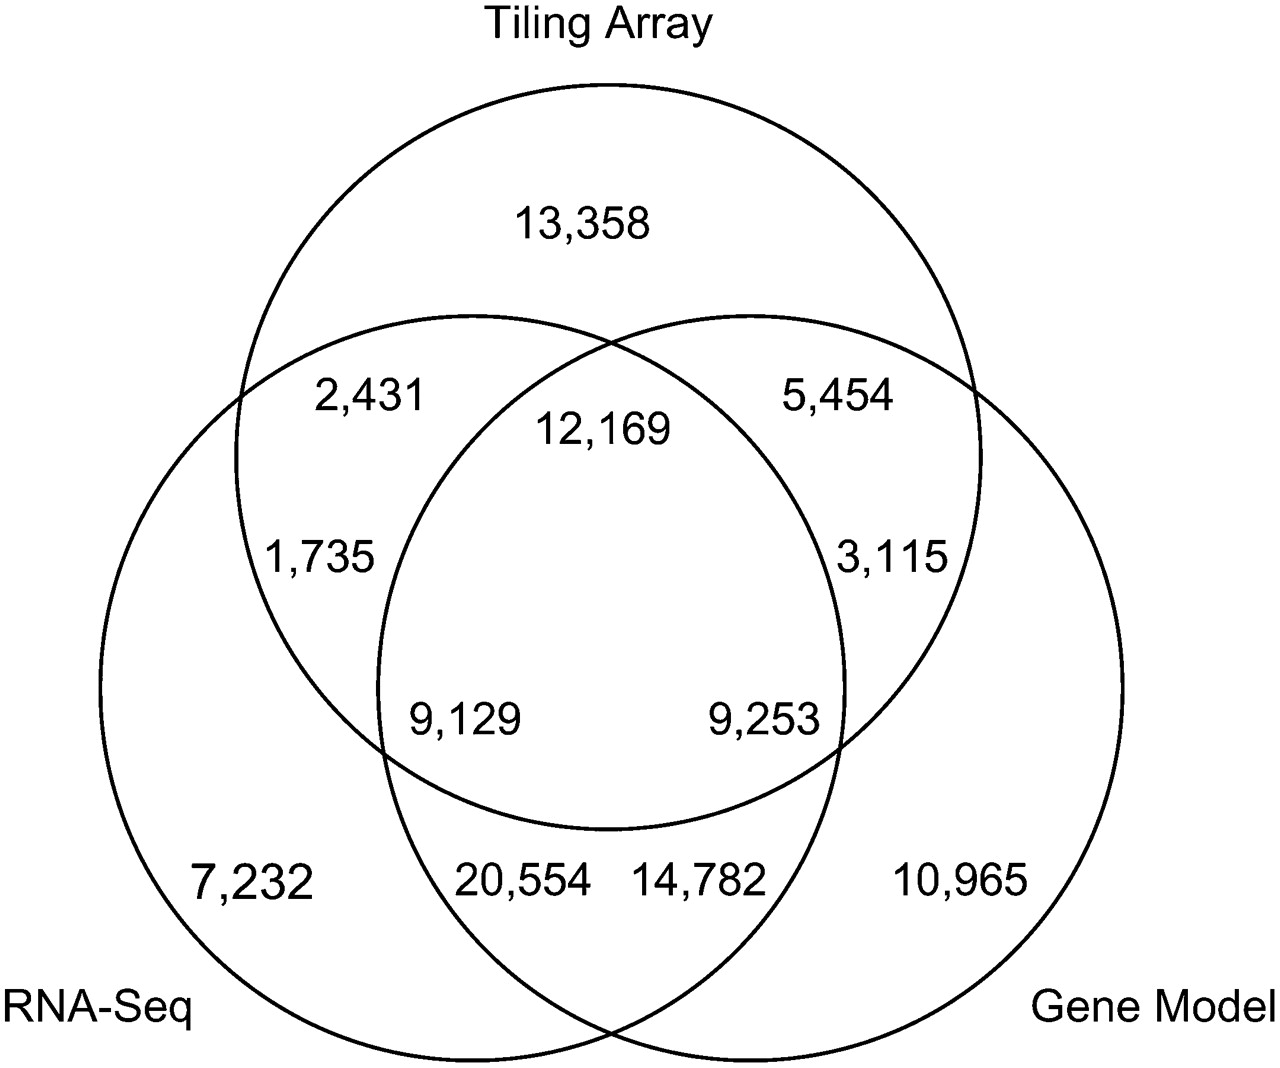
Figure 1.
Comparison of transcript units detected by RNA-seq and tiling array analyses. Numbers represent sizes of transcript unit sets. Tiling array data were obtained from the literature (Li et al. 2007) and RNA-seq data are from our study. The transcript units, according to the gene model, are collected as described in Methods.


