
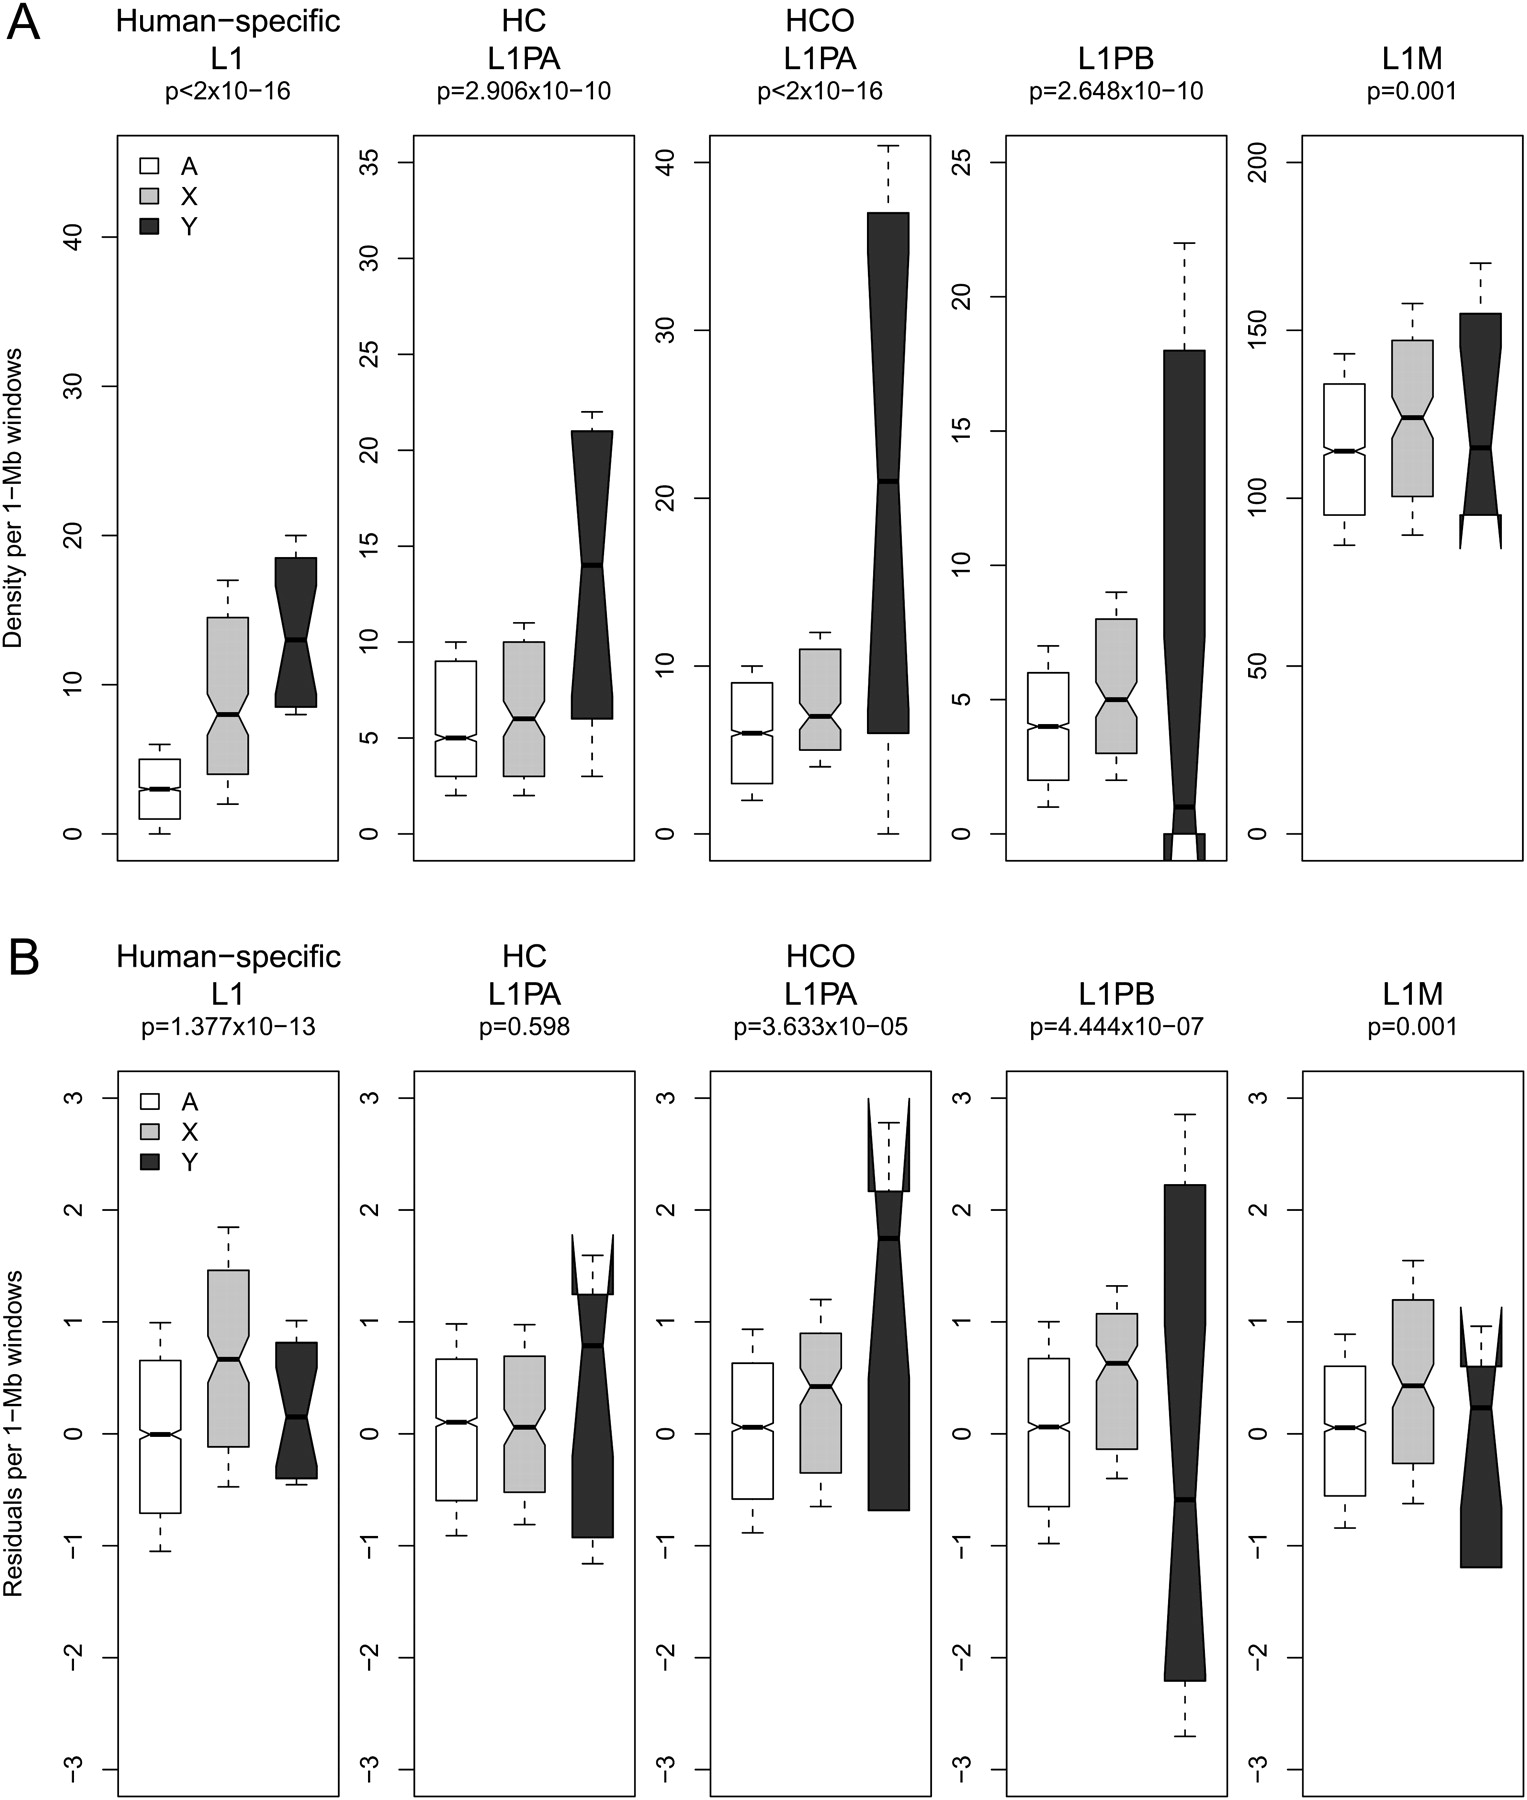
Figure 3.
Human sex chromosome (X, Y) versus autosome (A) distribution of observed (A) and corrected (B) densities of L1 elements in 1-Mb windows genome-wide. (A) Observed densities are plotted for L1s of various evolutionary ages including human-specific L1s; human–chimpanzee branch-specific (HC) L1PAs; and human–chimpanzee–orangutan branch-specific (HCO) L1PAs, L1PB, and L1M subfamilies, on the autosomes (white), X (light gray), and Y (dark gray) chromosomes. (B) Residuals from genome-wide multiple regression models represent densities corrected for local variation in genome landscape features. Notches on boxplots indicate the 95% confidence interval of the median.


