
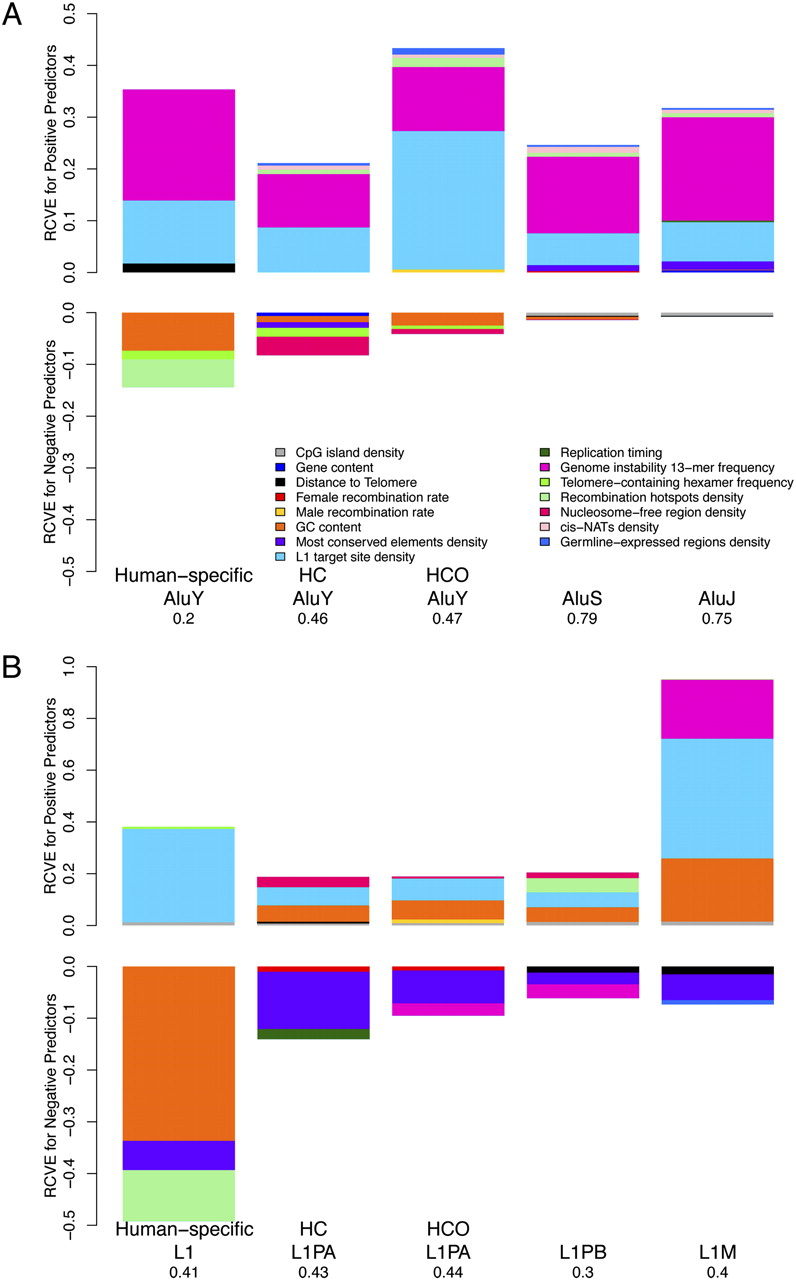
Relative contribution to variability explained (RCVE) for each genome landscape feature significant to modeling variation in densities of Alus (A) and L1s (B) in 1-Mb windows across the human genome. Results of regressions with either the Alu or L1 density of various evolutionary integration timings as response and genome-wide features as predictors are depicted as bar plots (for details, see Supplemental Table S3). Color-coded areas correspond to the relative share (RCVE) that each predictor contributes to the total variability explained, in the presence of all other predictors (for details, see Methods). Bar plots are proportional to the sum of the RCVEs for each multiple regression model. (HC) Human–chimpanzee branch-specific elements; (HCO) human–chimpanzee–orangutan branch-specific elements.


