
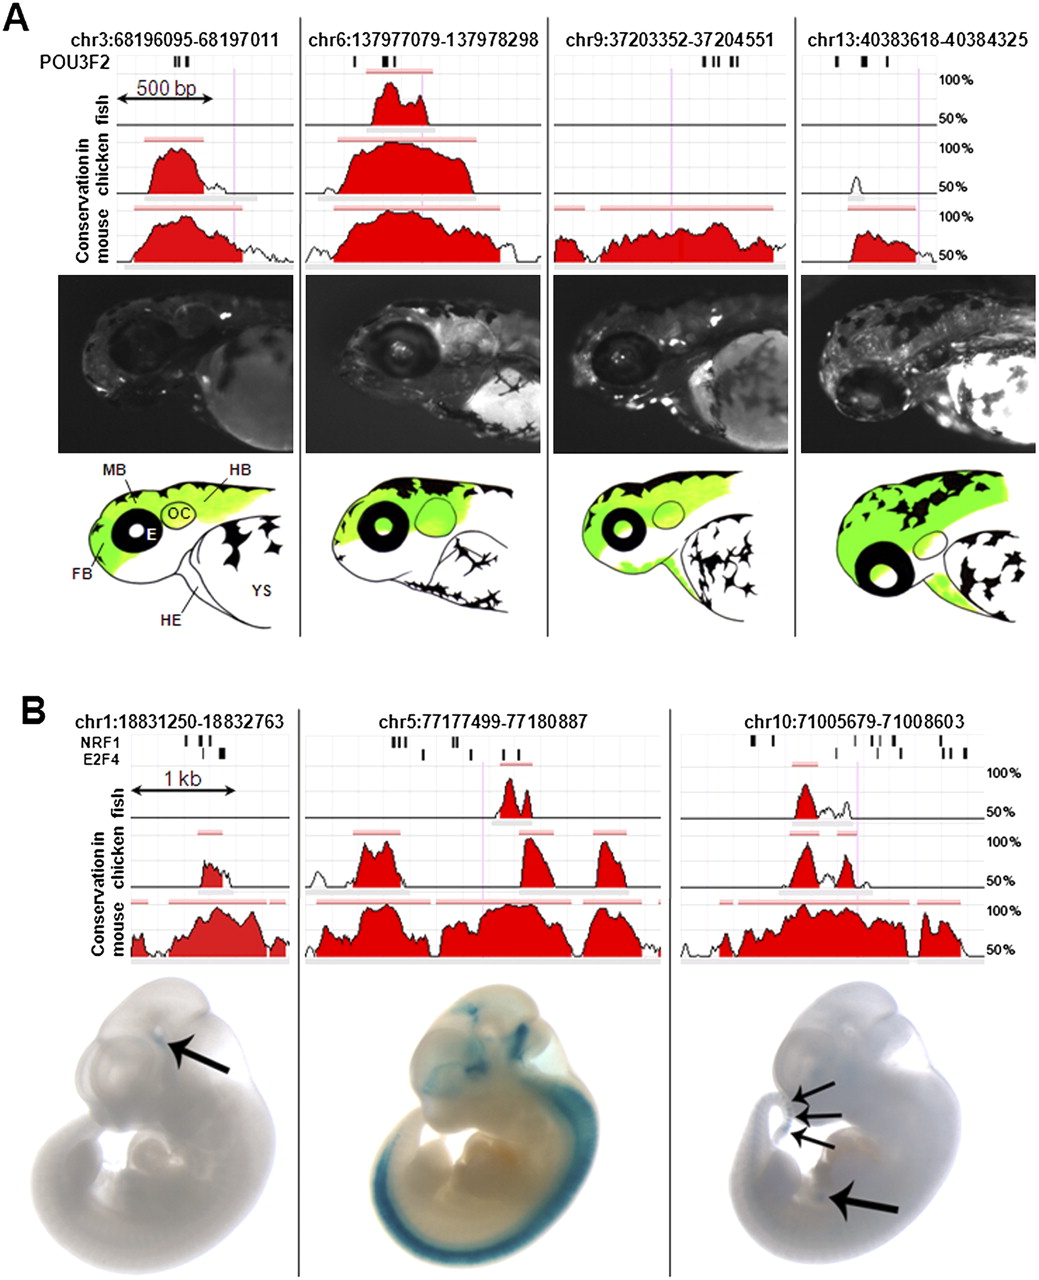
Experimental validation of predicted enhancers. (A) Four constructs containing POU3F2 HCTs that produced reproducible expression patterns of GFP in zebrafish. The sequence conservation profiles for mouse, chicken, and zebrafish represented as ECR Browser screen shots, correspond to the entire amplified regions (Table 6). Positions of the POU3F2 binding sites are represented by short vertical black bars above the conservation profile. All four elements are represented at the same scale. Pictures of 48–72-h post-fertilization zebrafish embryos with representative GFP expression patterns are shown below each element. The corresponding spatial domains of expression of each enhancer are also diagrammatically illustrated (regions where enhancer activity was recorded are shown in green). FB, forebrain; MB, midbrain; HB, hindbrain; E, eye; OC, otic capsule; HE, heart; YS, yolk sac. (B) Three constructs containing HCTs for NRF1 and E2F4 that produced reproducible LacZ expression pattern in transgenic mice. All three elements are represented at the same scale (this is different from the scale of elements tested in zebrafish). Arrows point to specific organs where the activity of these enhancers was observed, namely diencephalon for the enhancer on chromosome 1, and pancreas and caudal somites for the enhancer located in chromosome 10. Additional replicates for all elements presented here are included in the Supplemental material.


