
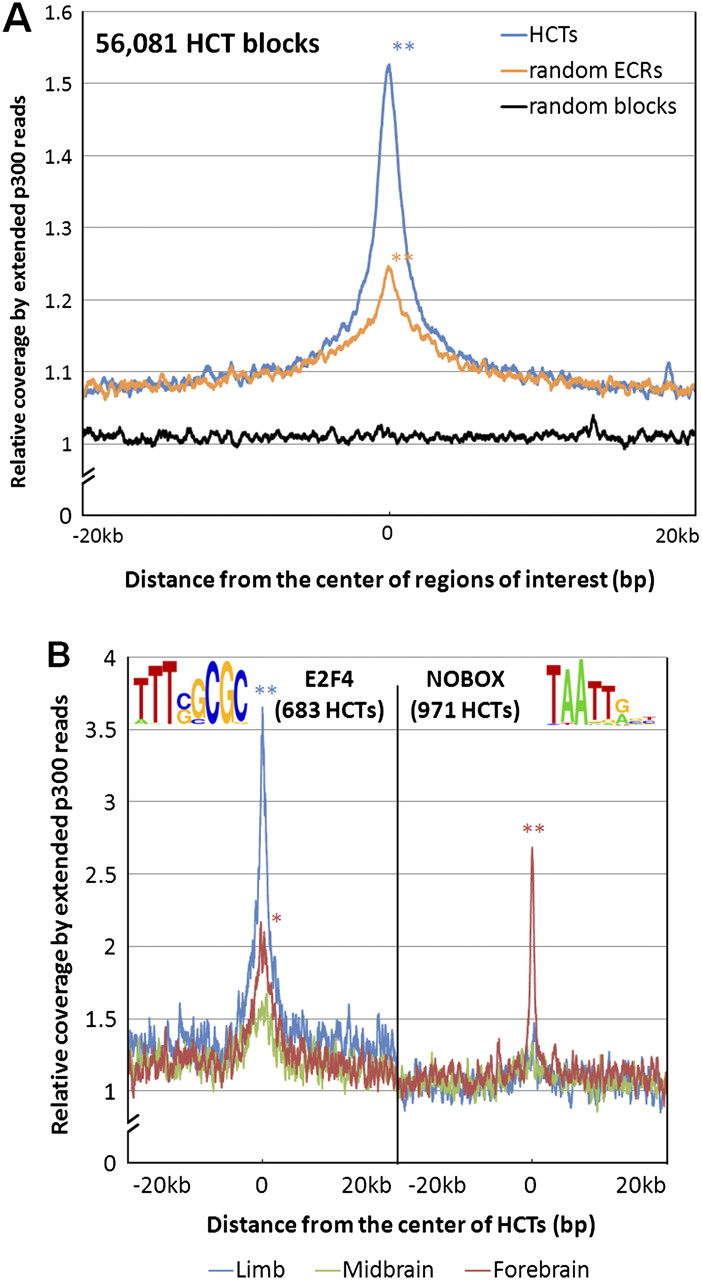
The enhancer activity of HCTs is supported by their association with the enhancer coactivator protein Ep300 in mouse. (A) Mouse HCTs corresponding to all human HCTs for 273 PWMs were combined into 56,081 regions (median size, 549 bp). Their Ep300 coverage profile was constructed by overlapping a total of 9,519,543 Ep300 reads with 40-kb regions centered on the middle point of HCTs. Even though ECRs are known to be significantly associated with Ep300 (P = 0), HCTs show an even stronger association by the means of a significantly higher Ep300 peak (P = 0). (B) Ep300 coverage profiles for HCTs of specific TFs and tissues reveal tissue-specific activity for certain TFs. For example, the coverage profile of 683 E2F4 HCTs reveals a peak significantly higher in limb than in either forebrain (P = 1.4 × 10⁻²¹) or midbrain (P = 1.2 × 10−40), while the difference between the forebrain and midbrain coverage is only marginally significant (P = 9.7 × 10⁻⁶). In the case of the 971 NOBOX HCTs, their coverage is significantly higher in forebrain than in either limb (P = 2.7 × 10⁻²⁷) or midbrain (P = 7.3 × 10−43), while limb and midbrain coverage are not significantly different from each other (P = 0.07). These data strongly suggest a limb-specific activity for E2F4 HCTs, and a forebrain-specific activity for NOBOX HCTs. Statistical significance was evaluated with Fisher's exact test, as in Visel et al. (2009);*P < 0.01; **P < 10−20.


