
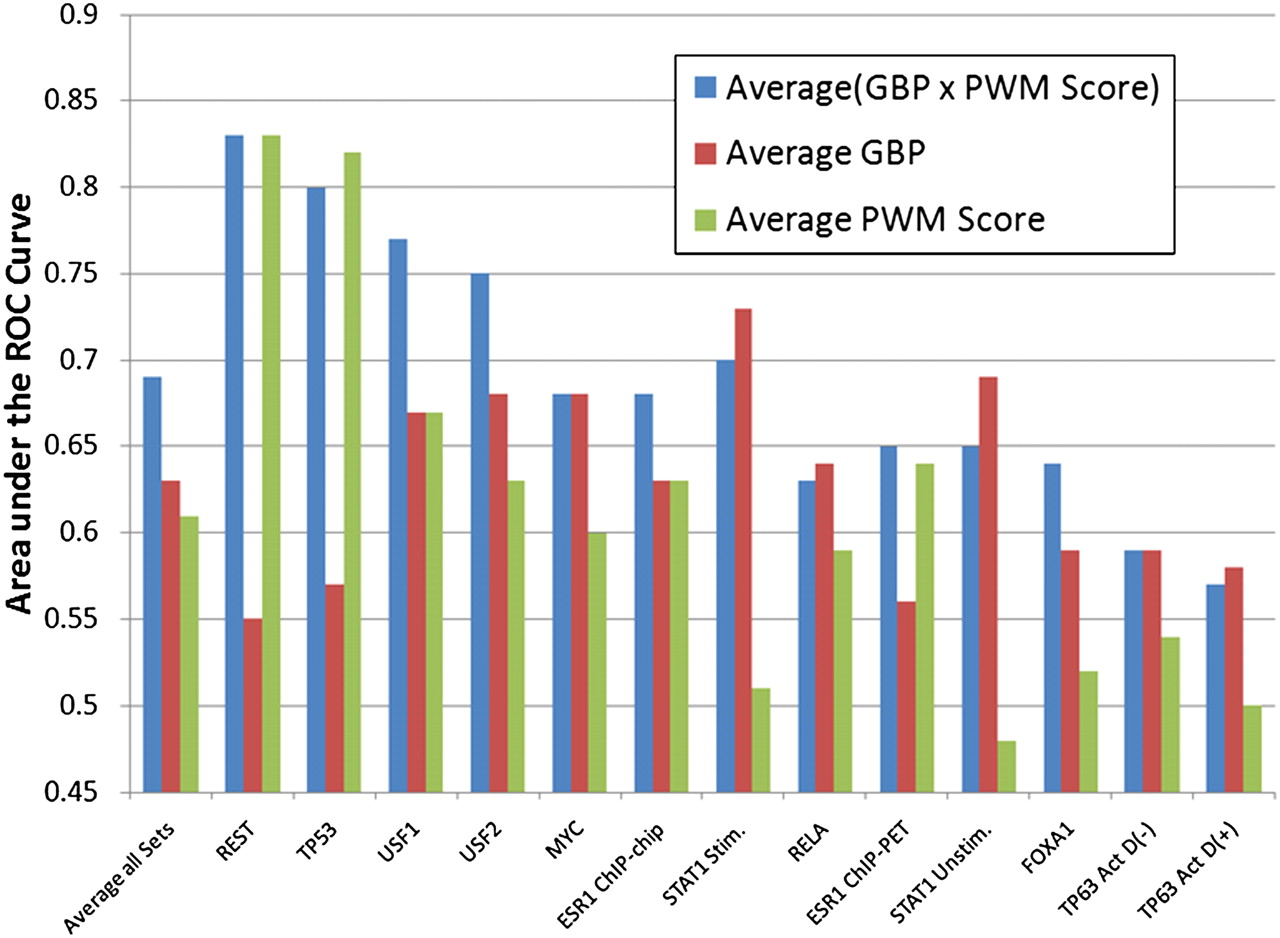
Figure 4.
Comparison of AUC values for predicting if a transcription factor binding site lies within 10,000 bases of a RefSeq transcription start site. Shown are the AUC values for the ROC curves in Supplemental Figure 3. The leftmost bars plot the average over all data sets. As can be seen, by combining the GBP with the motif scanning score, we improve the prediction of regions bound by specific transcription factors.


