
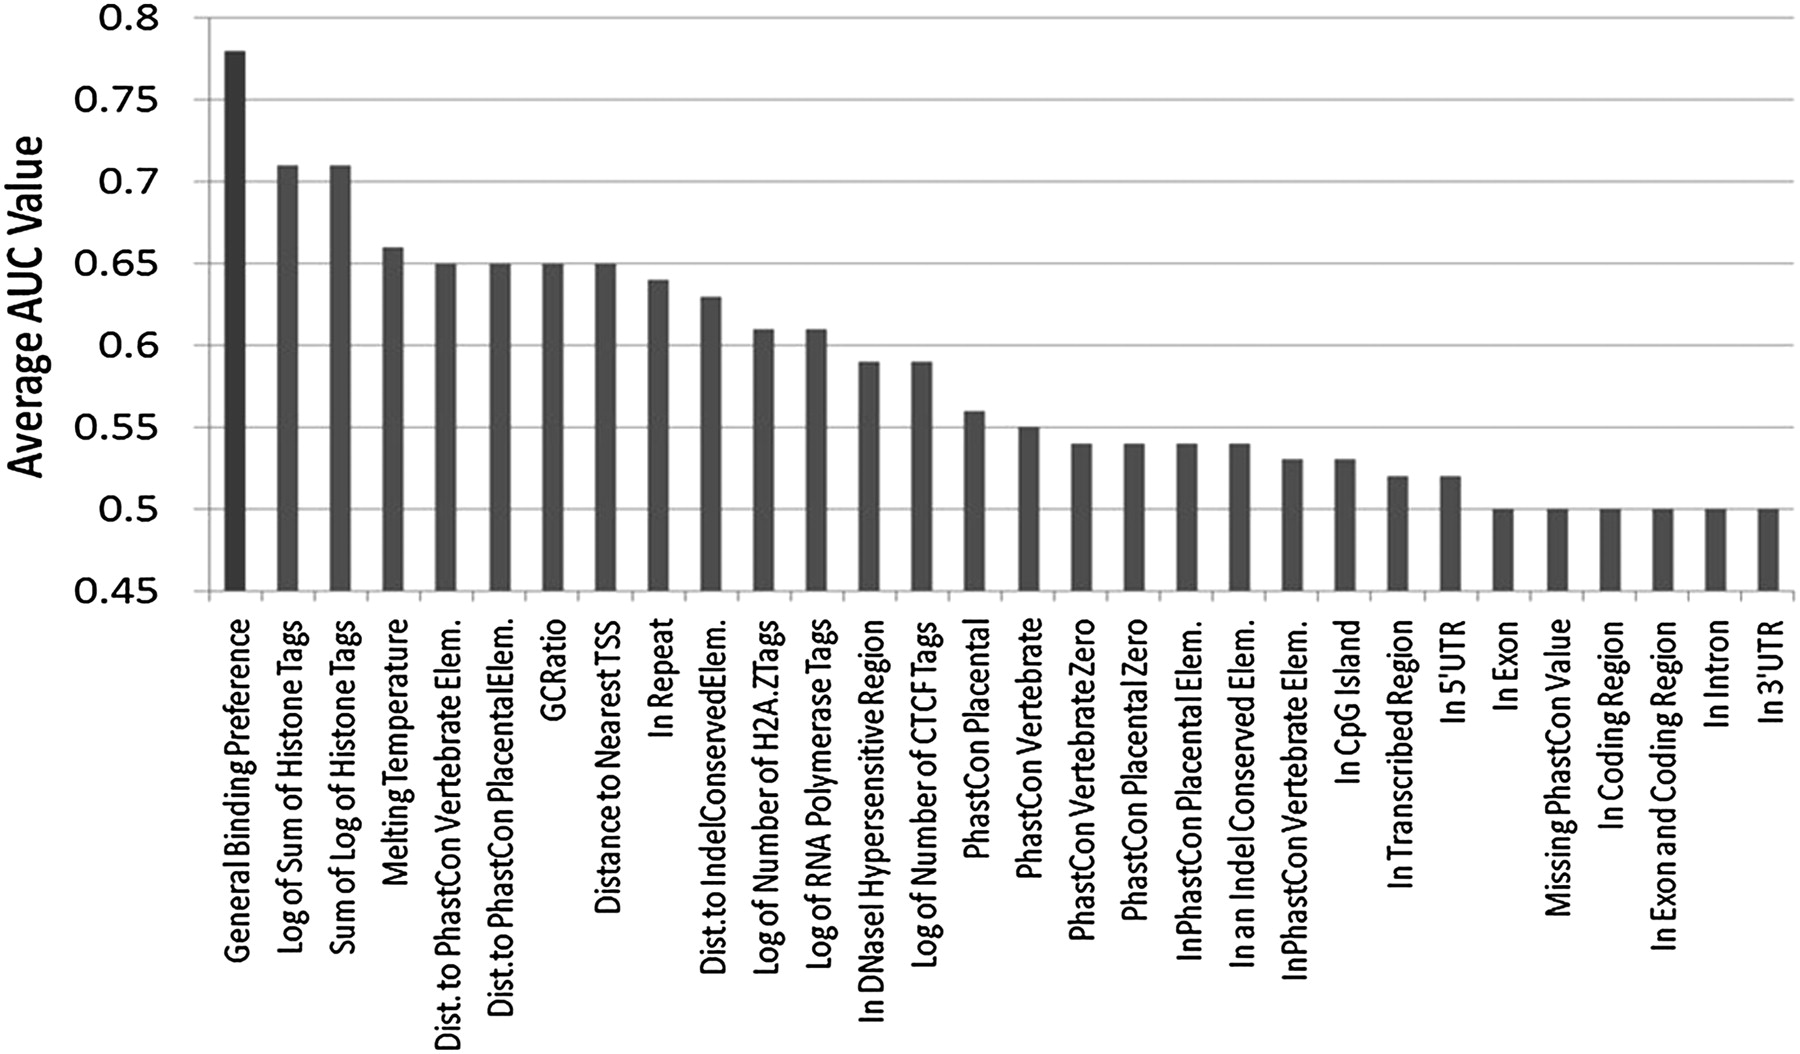
Figure 3.
Comparison of average AUC values for our GBP and individual features. This graph compares the average AUC value obtained across all 14 data sets and to the cross-validation AUC value when combining the features together using our method. The graph shows the highest average AUC value obtained when combining all features using our method. The individual values that were used to compute these averages can be found in Supplemental Table 1.


