
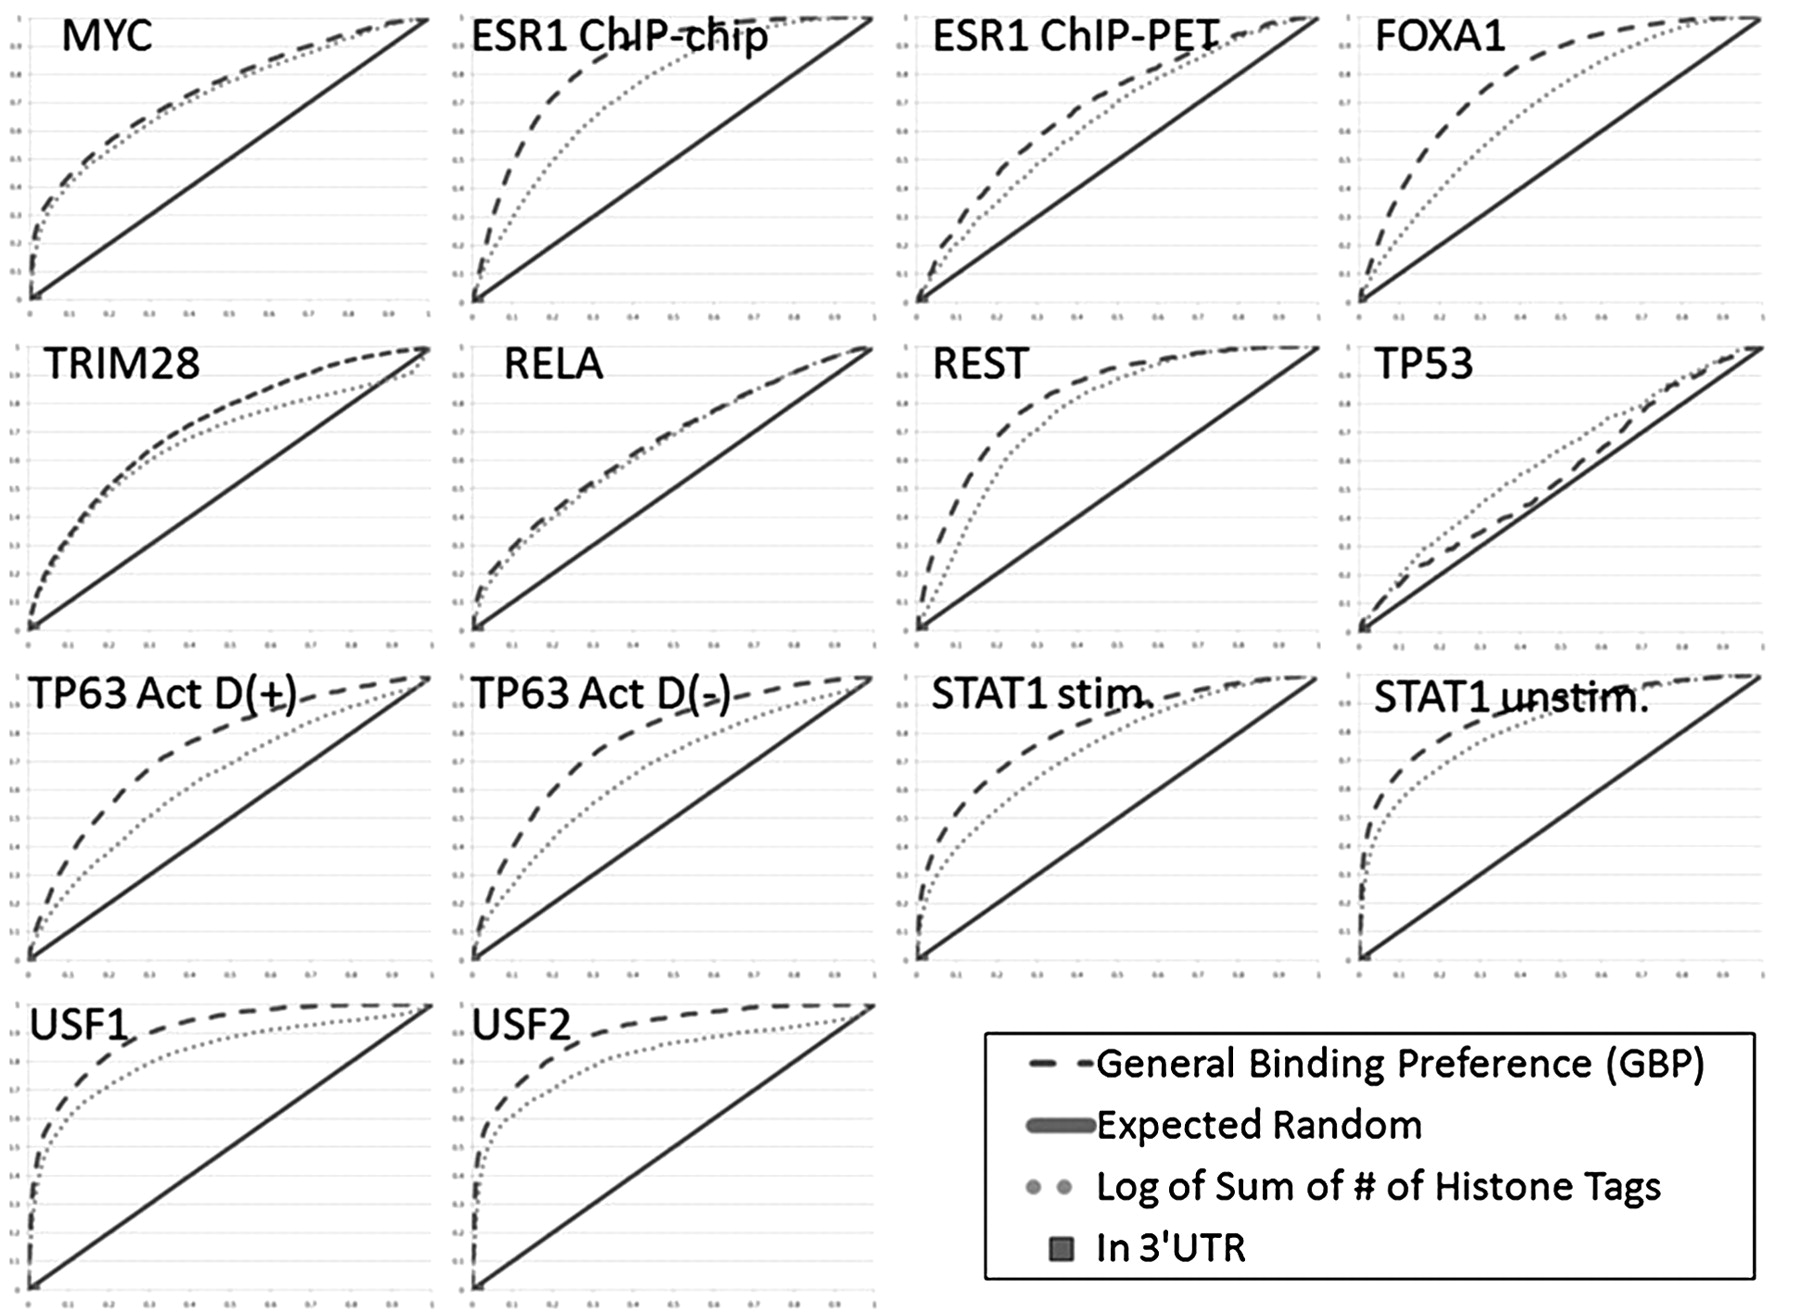
The ability of the GBP to differentiate between reported bound sites and random sites. ROC curves for a number of different methods for predicting bound locations. (X-axis) False-positive rate; (y-axis) true-positive rate. Results of predictions made by our method using cross-validation analysis for this factor (dashed line); expected performance of a random guess (solid line). Also plotted are the ROC curve for a feature based on histone modifications (dotted line) and a point for the 3′ UTR feature. These were selected since they achieved the highest and lowest average AUC values, respectively. An extended version of this plot with additional features can be found in Supplemental Figure 2.


