
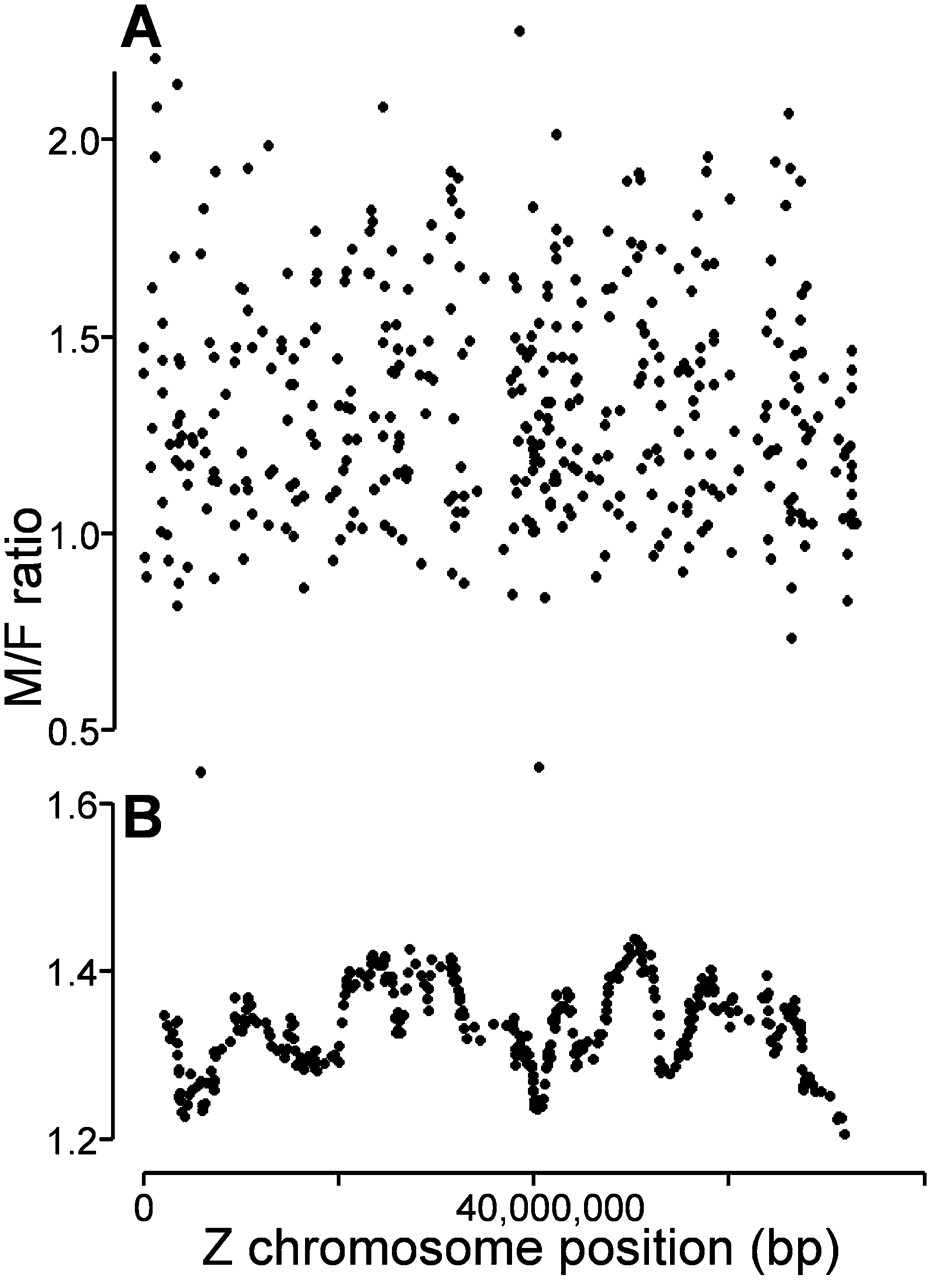
Figure 2.
Sex bias in gene expression along the zebra finch Z chromosome. (A) Plot of M:F ratios of expression ratios of individual Z genes as a function of Z chromosome gene position using data from day 45 zebra finch telencephalon. (B) Graph of the running average of 30 M:F ratios of expression (data from A) plotted at the median gene position along the zebra finch Z chromosome.


