
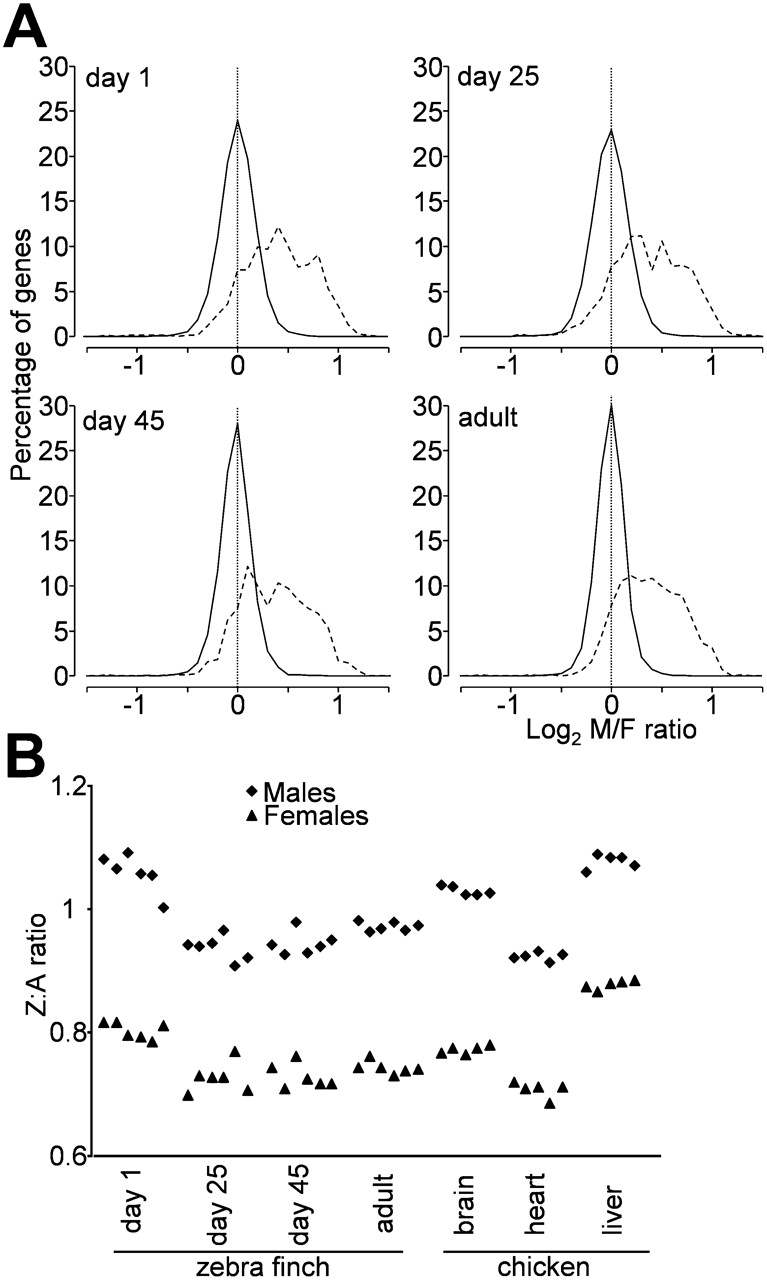
(A) Distributions of log2 male-to-female (M:F) ratios of gene expression ratios for zebra finch telencephalon at four ages. Autosomal (A) genes (solid line) have a distribution around a mode of 1 (log2 ratio of 0), showing that average autosomal genes are not sex-biased. The width of the distribution is a measure of overall sex bias, which is smallest in adulthood. In contrast, the distribution for Z genes (dotted line) is shifted significantly to the right, indicating that there is an overall male bias of Z genes. Nevertheless, some Z genes show no sex bias, indicating that some process compensates for the sex difference in Z copy number for those genes. Bin size = 0.1. (B) Z:A ratios of expression for each individual zebra finch (left), compared to published values for chicken embryo (Itoh et al. 2007). In general, Z:A ratios were comparable in the two species, with values in male near 1 and values in females near 0.8.


