
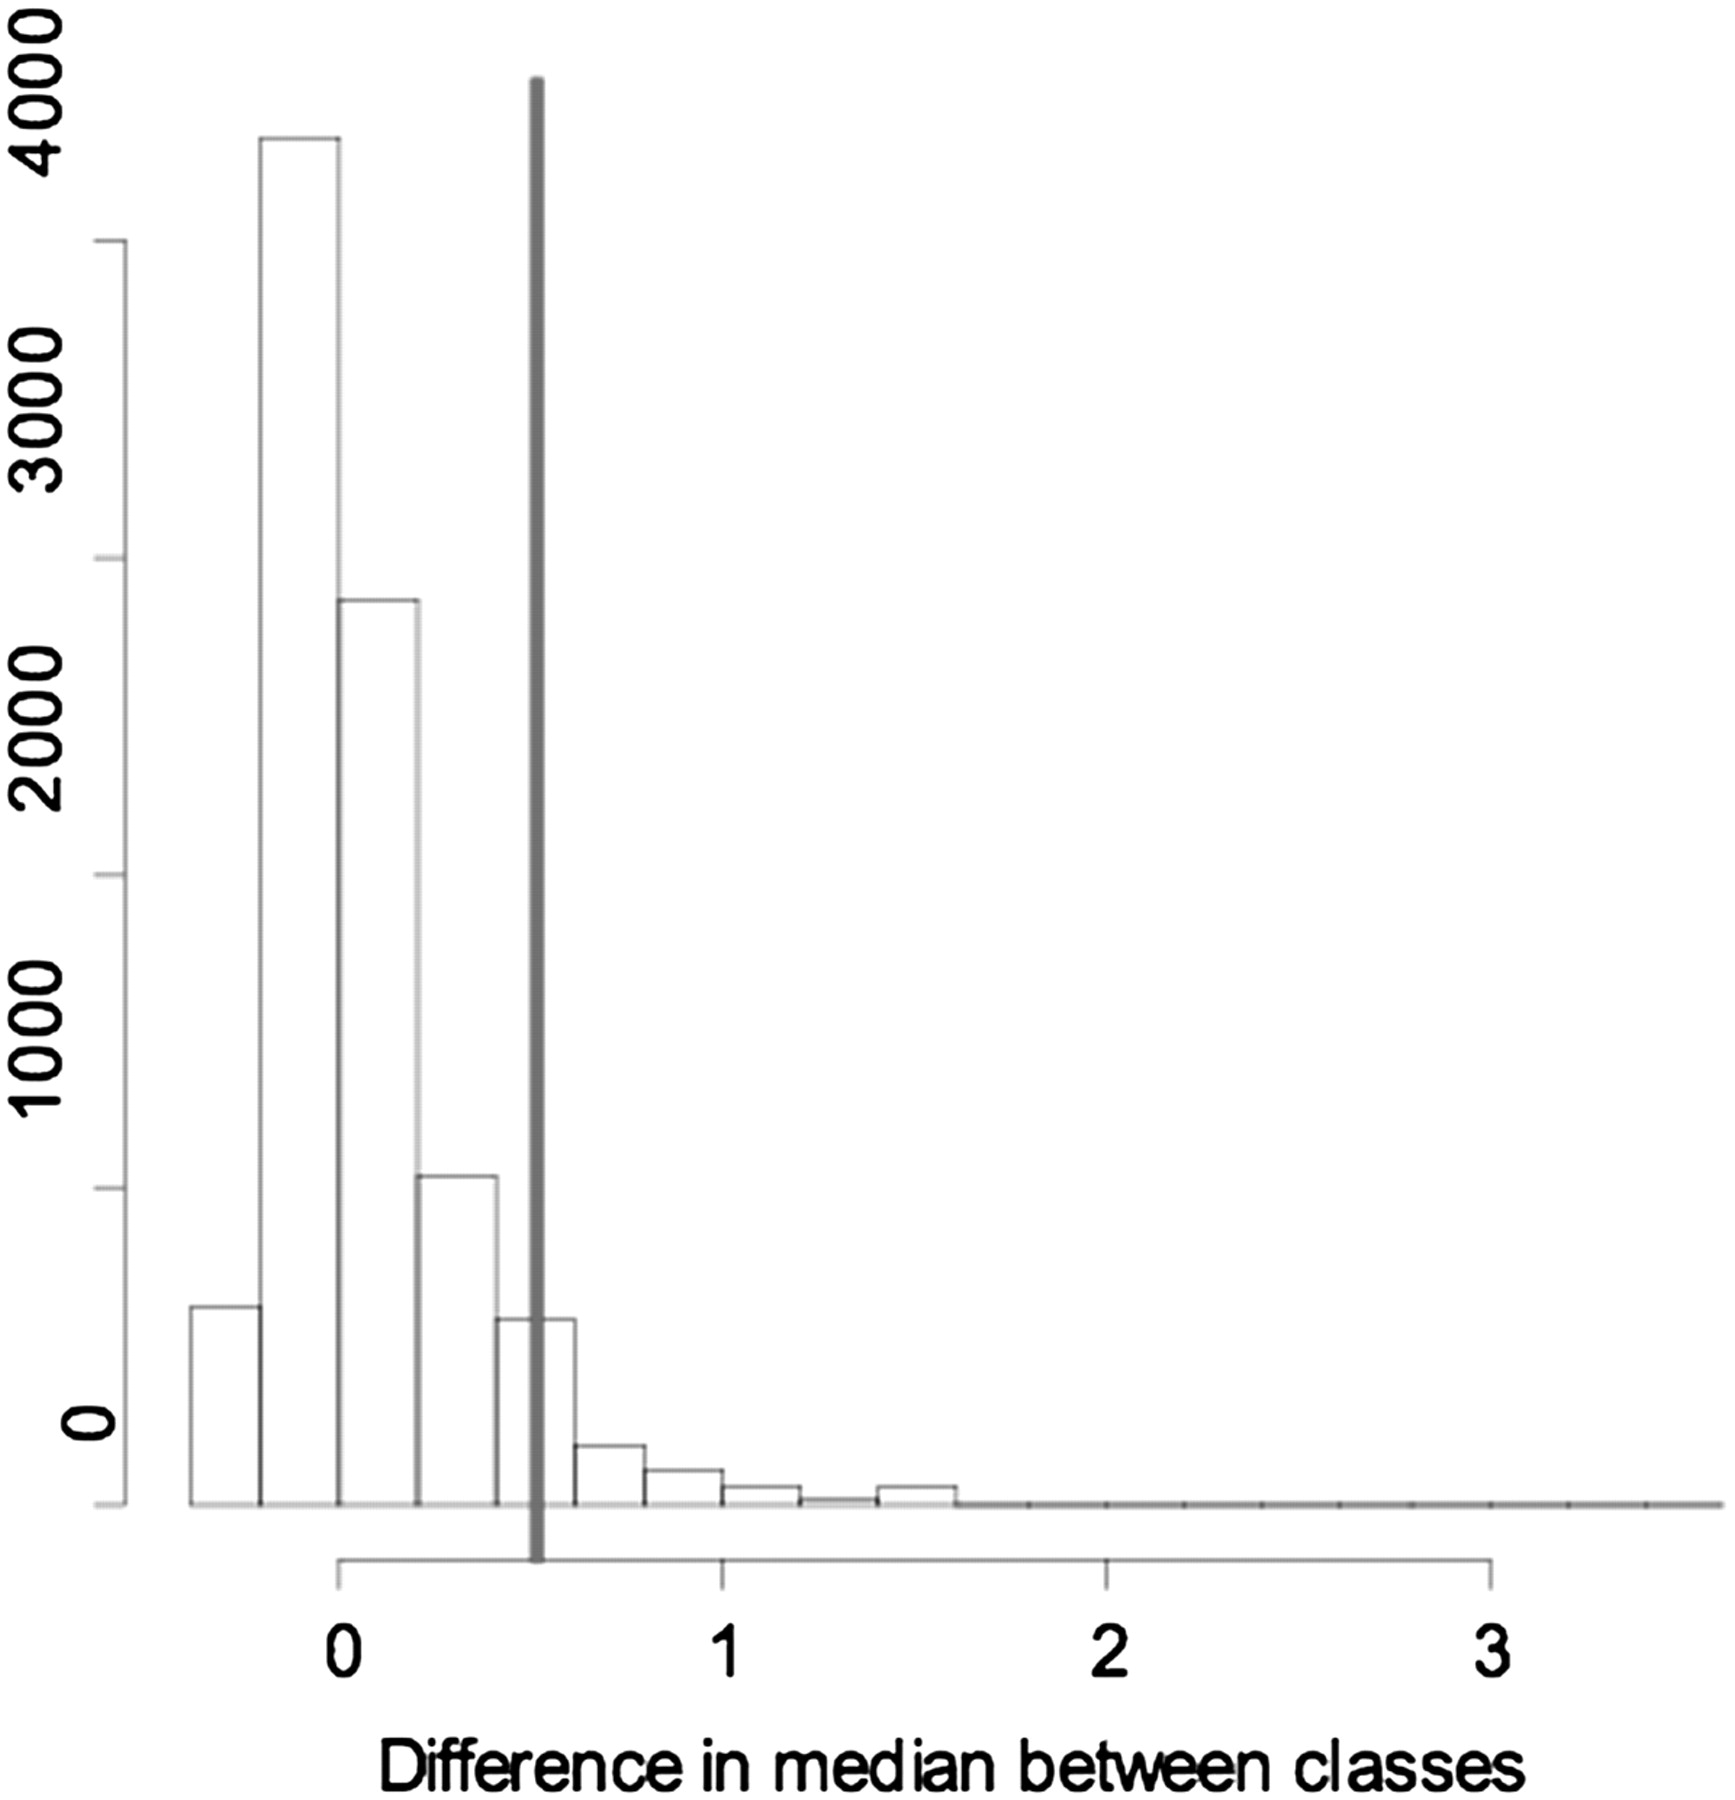
Figure 4.
An illustration of the randomization test. The histogram shows the distribution of the difference in median recombination rate between 17 windows drawn at random from the entire sample and the remaining windows. The thick vertical line represents the observed difference in median recombination rate between the 17 windows that contain CNVRs (median = 0.74 cM/Mb) and the remaining 741 windows (median = 0.23 cM/Mb).


