
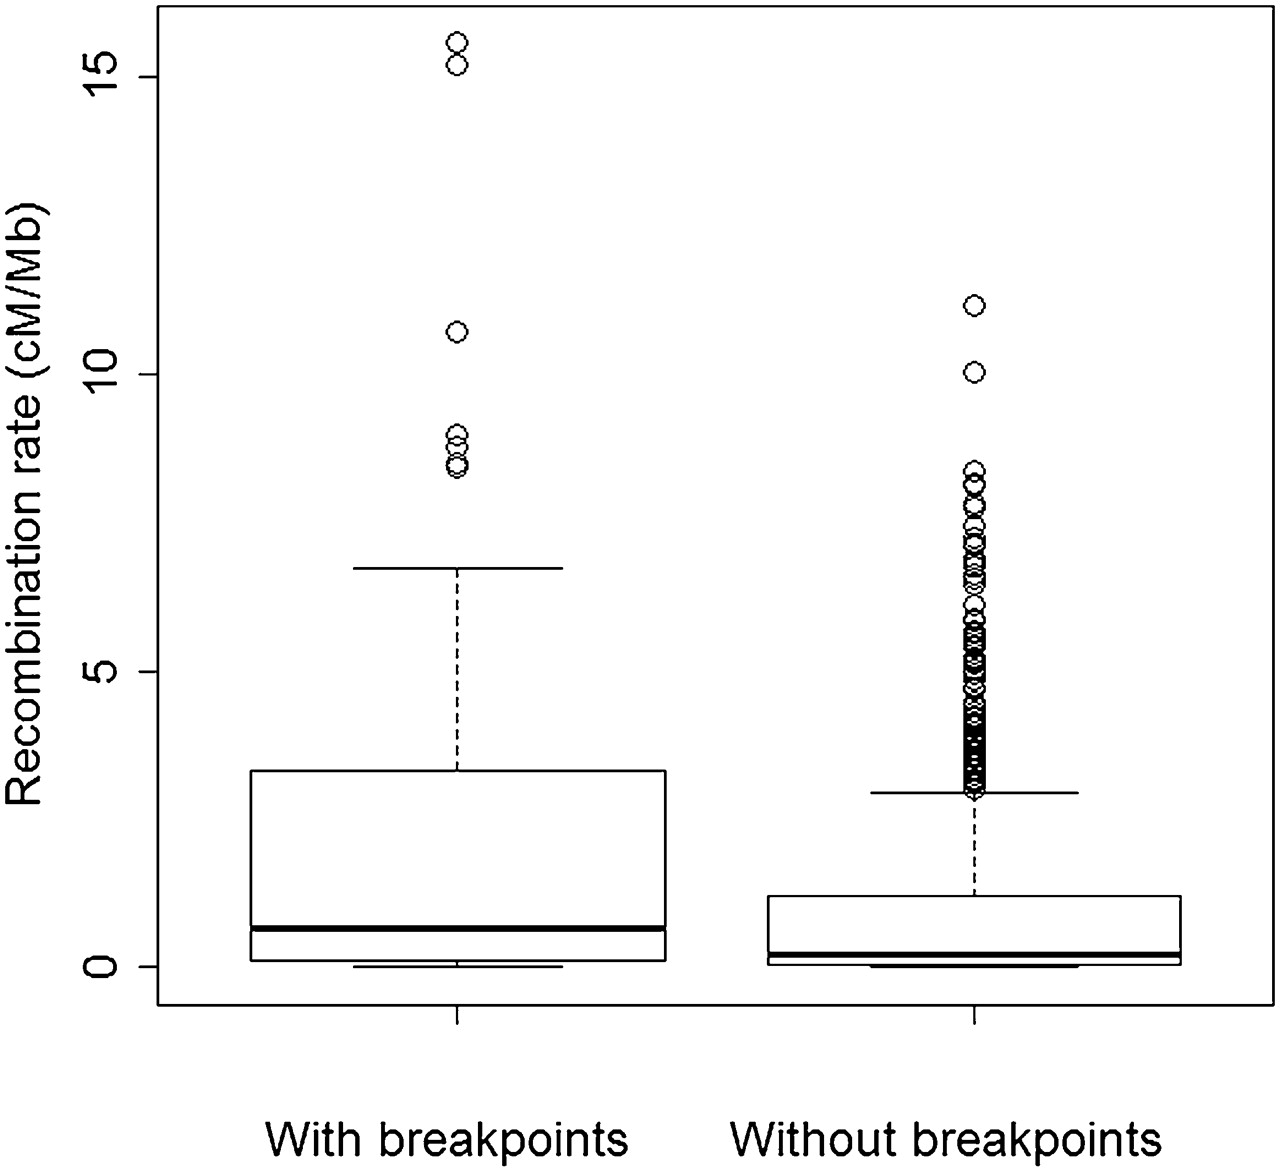
Figure 3.
Box-whisker plot representing the recombination rates in 118 1-Mb windows in regions with chromosomal breakpoints (mean ± SD = 2.13 ± 3.03 cM/Mb) and in 643 1-Mb windows without chromosomal breakpoints (1.14 ± 1.95 cM/Mb). The observed difference between the two is statistically significant (Wilcoxon's rank sum test, W = 6376, P = 0.0000183).


