
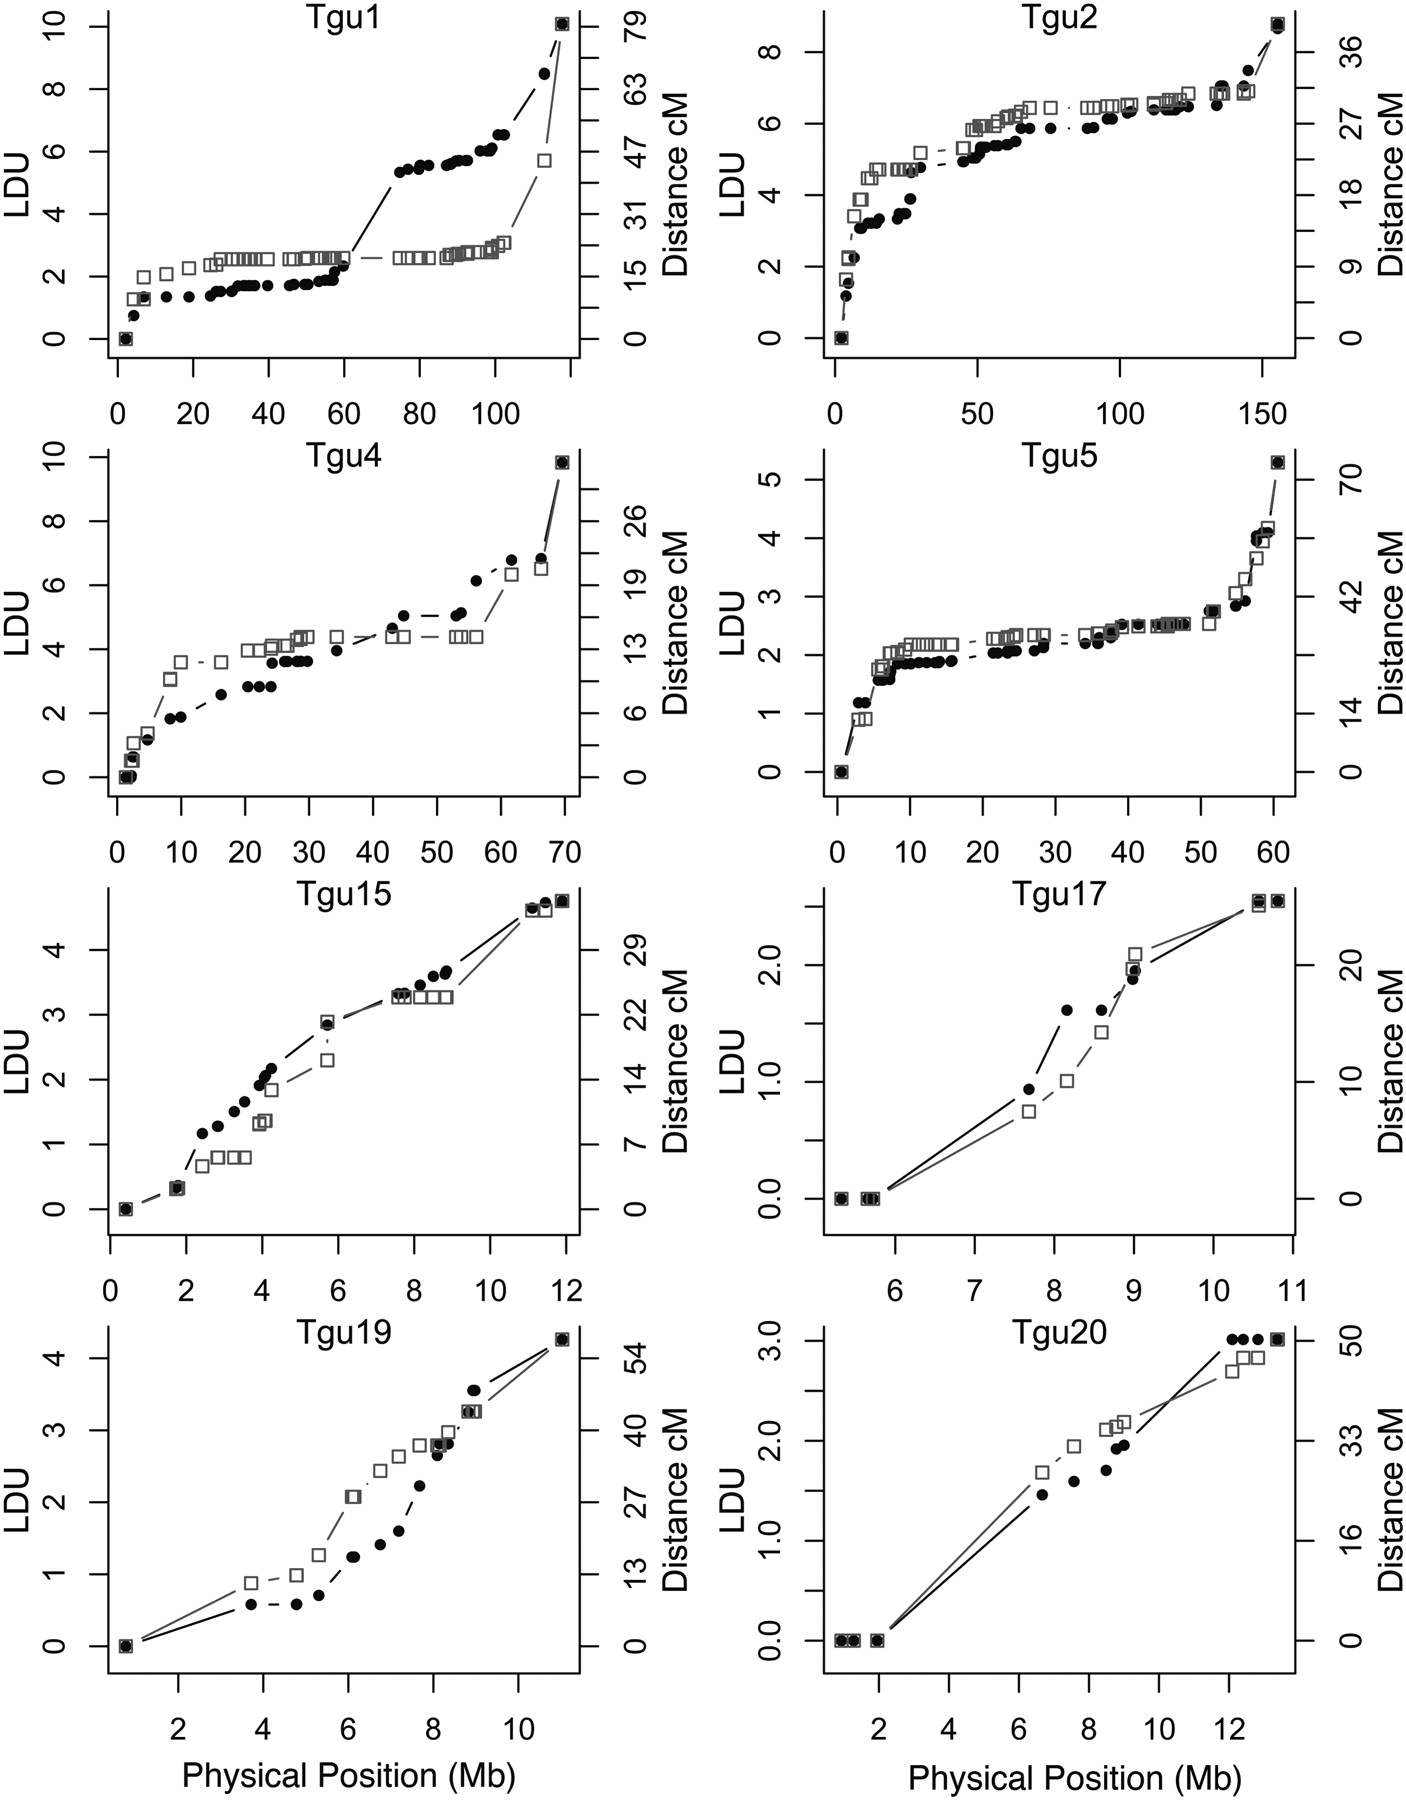
LD maps (LDU) and genetic maps (cM) plotted against physical distance along four macrochromosomes (Tgu1, Tgu2, Tgu4, and Tgu5) and four microchromosomes (Tgu15, Tgu17, Tgu19, and Tgu20). (Solid circles and black lines) LD map; (open gray squares and gray lines) genetic map. This figure demonstrates large regions of extended LD on the macrochromosomes, corresponding to low recombination in the center and high recombination at the ends. In contrast, this pattern is not consistently evident on the microchromosomes, where the relationship between LD and physical distance is mostly linear. See Supplemental Figs. S5.1–S5.4 for all chromosomes.


