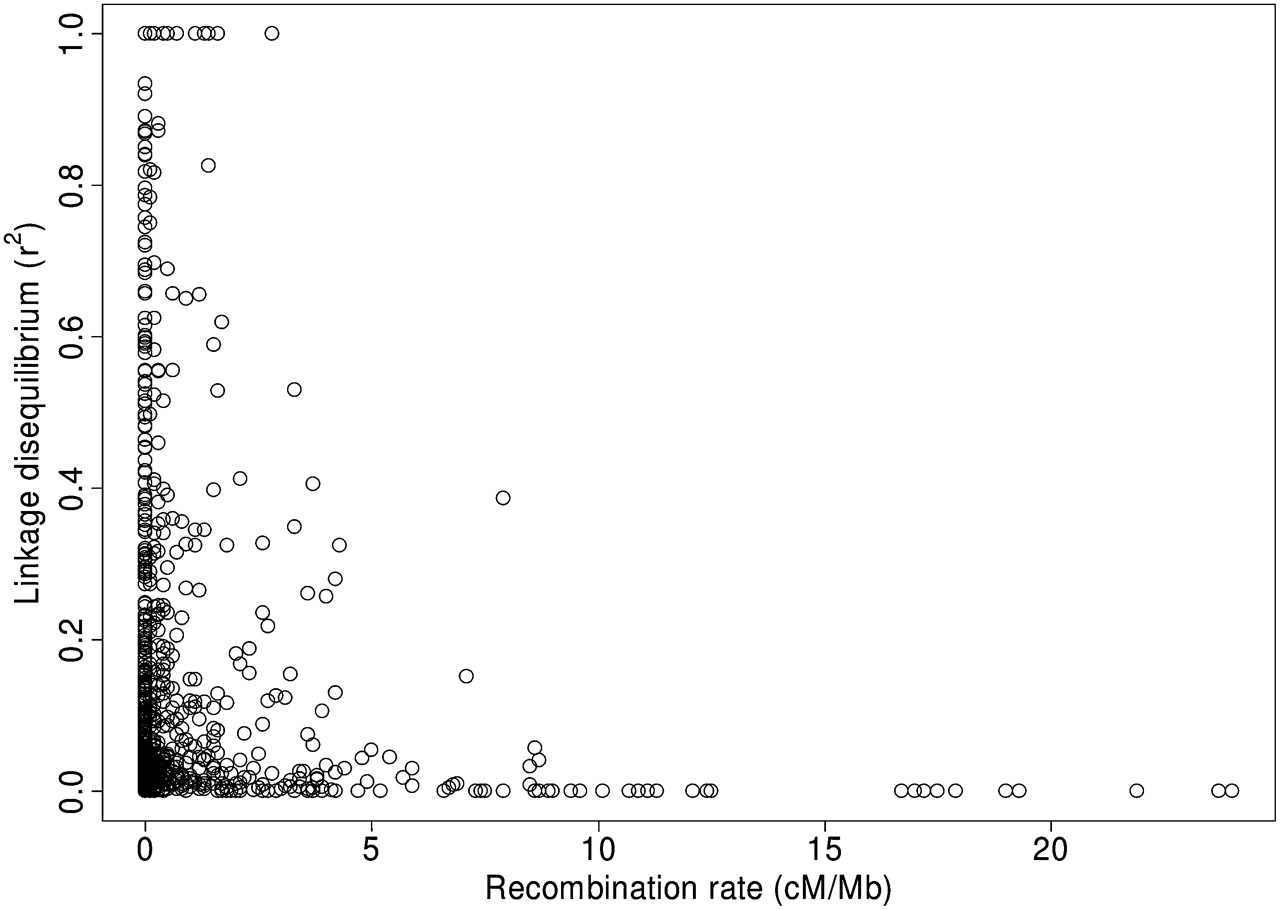
The recombination landscape of the zebra finch Taeniopygia guttata genome

(Downloading may take up to 30 seconds. If the slide opens in your browser, select File -> Save As to save it.)

Click on image to view larger version.

Figure 6.
Figure 6.

The relationship between the recombination rate (cM/Mb) and the level of linkage disequilibrium (r2) for all adjacent marker pairs within linkage groups in the zebra finch genetic map.

This Article

  1. Genome Res. 20: 485-495

Preprint Server