
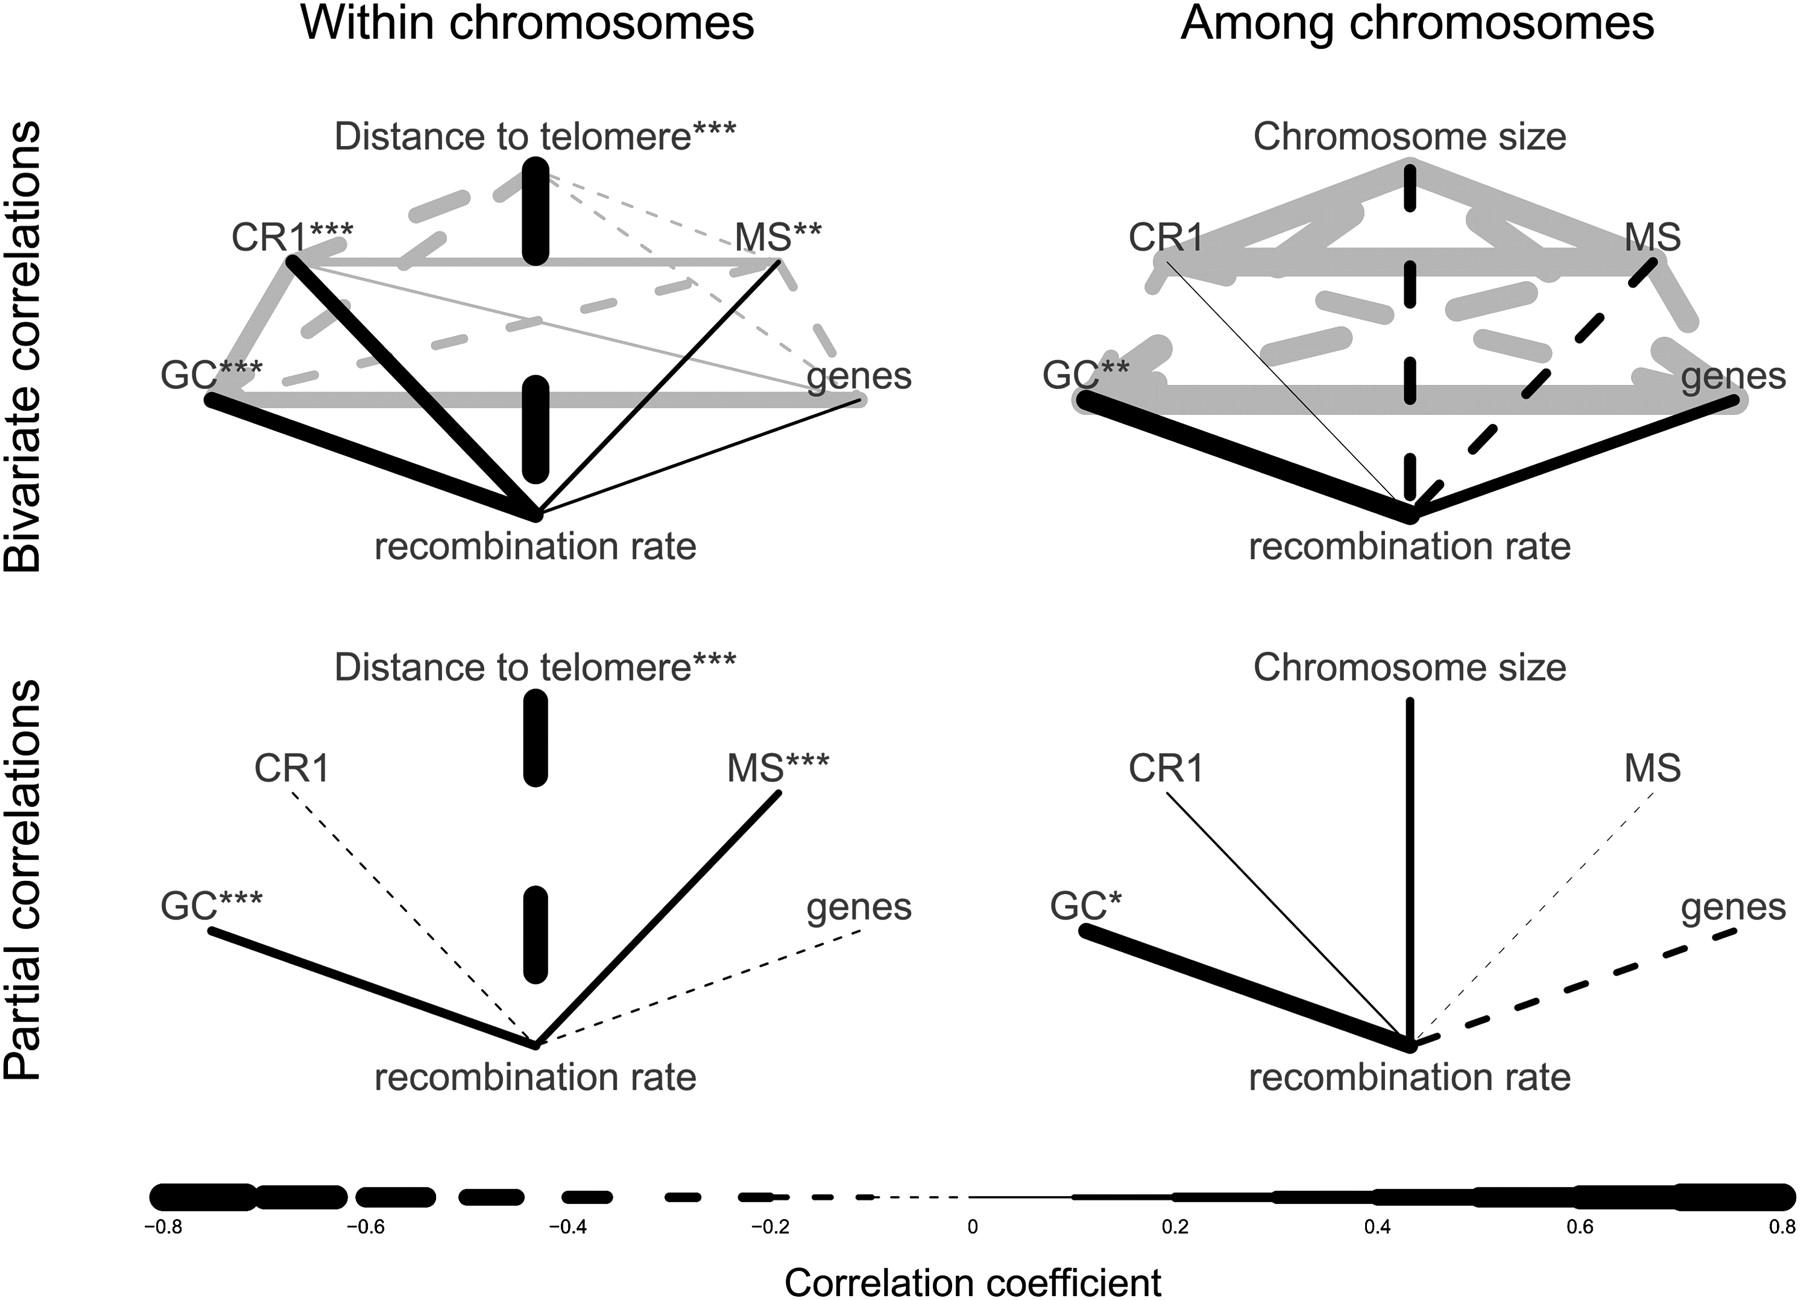
Figure 5.
Correlations between recombination rate and genomic parameters. The upper two plots show raw pairwise correlations between genomic parameters and recombination rate, while the lower two plots show partial correlations controlling for all other genomic parameters in the plot. (Solid lines) Positive correlations; (dashed lines) negative correlations. Line width is proportional to the strength of the correlations. Gray lines show correlations among genomic parameters. Asterisks indicate significance levels for correlations with recombination rate (black lines; *P < 0.05; **P < 0.01; ***P < 0.001). CR1, chicken repeat 1 retrotransposon; MS, microsatellites.


