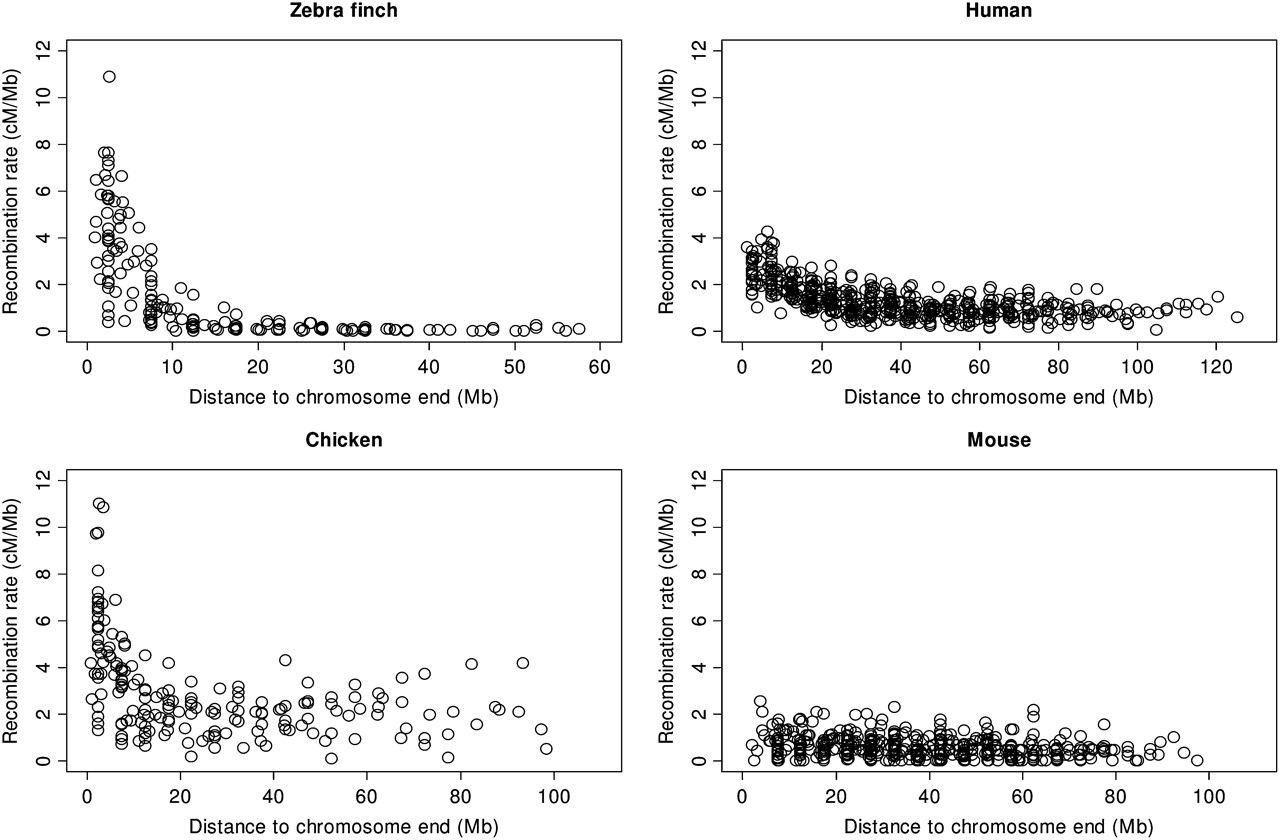
The recombination landscape of the zebra finch Taeniopygia guttata genome

(Downloading may take up to 30 seconds. If the slide opens in your browser, select File -> Save As to save it.)

Click on image to view larger version.

Figure 4.
Figure 4.

The relationship between the distance to the chromosome end (Mb) and the recombination rate (cM) measured in 5-Mb windows in zebra finch (this study), chicken (Groenen et al. 2009), mouse and human (Jensen-Seaman et al. 2004).

This Article

  1. Genome Res. 20: 485-495

Preprint Server