
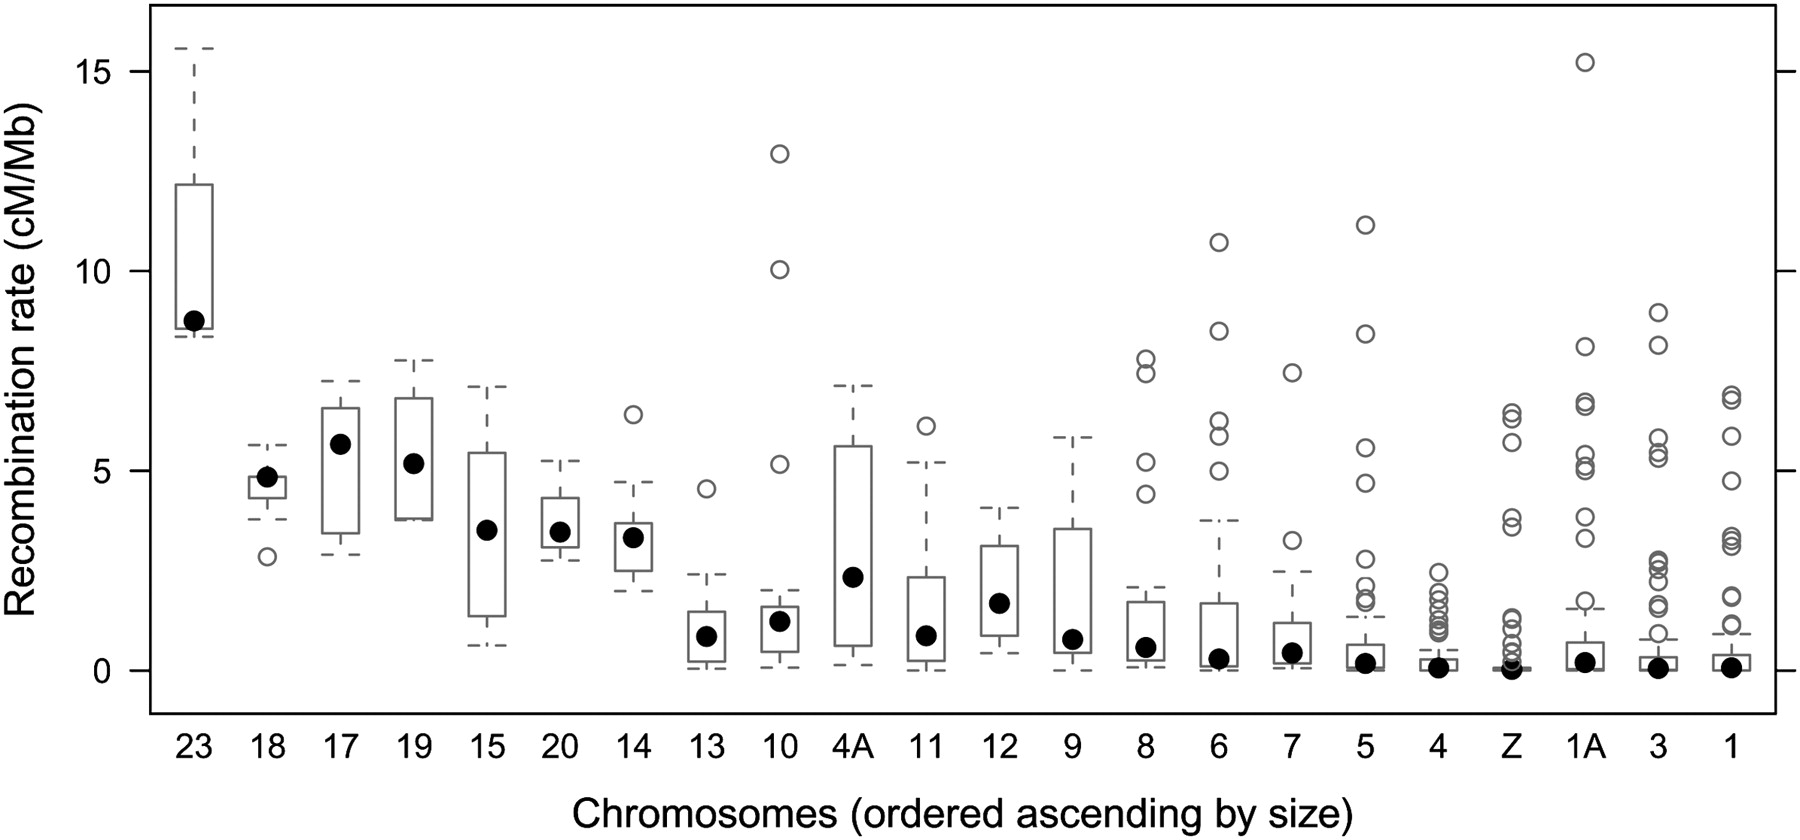
Figure 3.
Box-and-whisker plots for recombination rate in 1-Mb windows across chromosomes. Filled dots show the median and boxes the interquartile ranges. Outside the boxes, whiskers mark the largest and smallest values within 1.5 times the interquartile range, and open dots show data points outside the whisker range.


