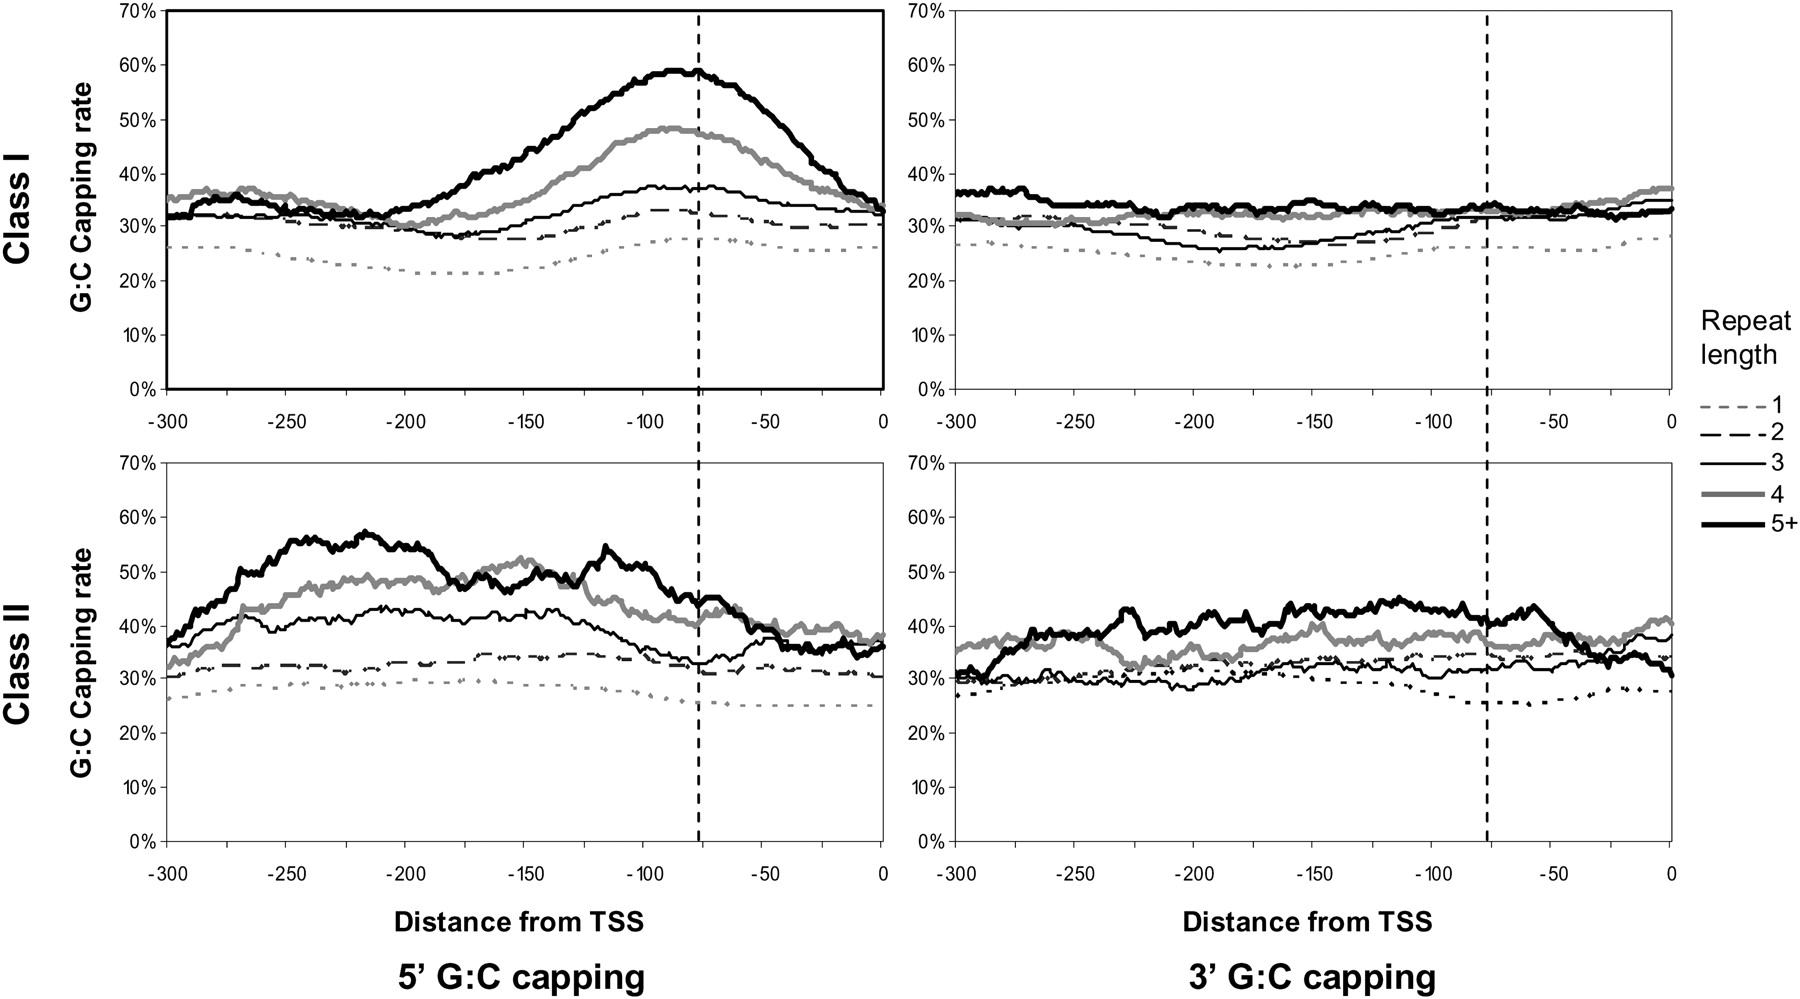
Positioned and G/C-capped poly(dA:dT) tracts associate with the centers of nucleosome-free regions in yeast promoters

(Downloading may take up to 30 seconds. If the slide opens in your browser, select File -> Save As to save it.)

Click on image to view larger version.

Figure 5.
Figure 5.

5′ and 3′ G:C-capping rates, as functions from the TSS in class I and class II promoters. Patterns denote different poly(dA:dT) tract lengths; tracts 5 and longer were pooled for statistical accuracy. Vertical dashed line indicates the position of the symmetric axis for the average class I promoter.

This Article

  1. Genome Res. 20: 473-484

Preprint Server