
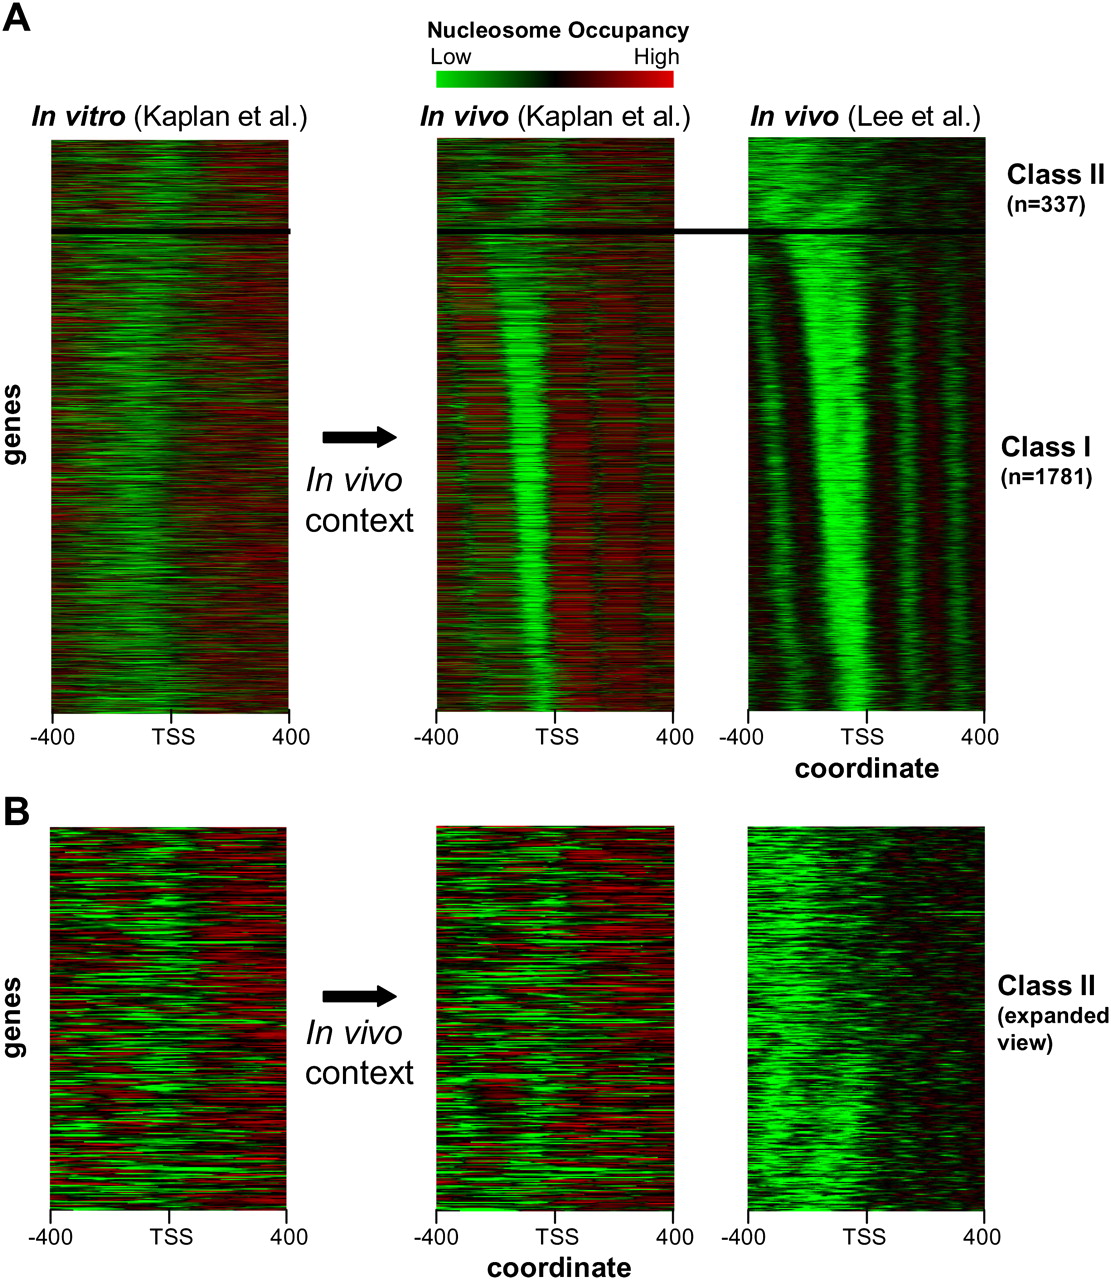
Figure 1.
Comparison of in vitro and in vivo nucleosome maps at yeast promoters. (A) Nucleosome maps from tiling array data (Lee et al. 2007) for 2118 S. cerevisiae promoters were clustered using a self-organizing map (SOM) and visually partitioned into two groups (class I and class II). In vivo and in vitro nucleosome maps (Kaplan et al. 2008) were ordered according to the SOM. Maps were aligned according to transcriptional start sites determined using tiling arrays (David et al. 2006). (B) Close-up of the class II promoter class.


