
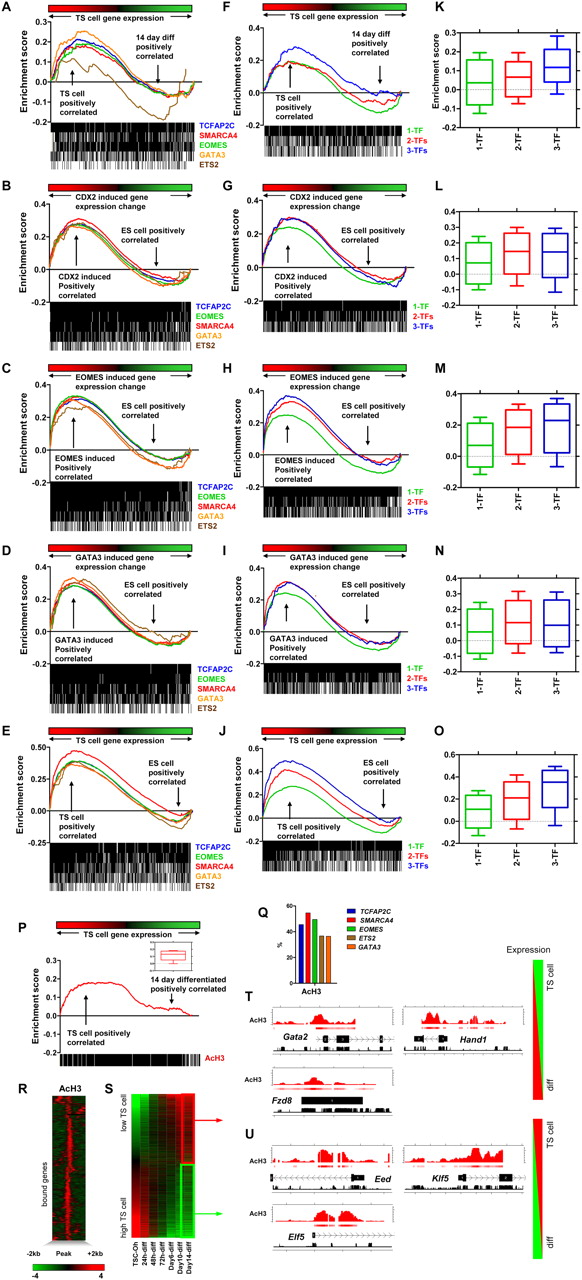
GSEA analysis of TF occupied genes and histone H3 acetylation (AcH3) in TS cells. GSEA analysis of TF target genes in undifferentiated and differentiated TS cells (A); Cdx2- (B), Eomes- (C), and Gata3-overexpressing (D) ES cells; and TS cells and ES cells (E). The majority of target genes are expressed higher in undifferentiated compared with differentiated TS cells, and Cdx2-, Eomes-, and Gata3-overexpressing ES cells compared with control ES cells, and TS cells compared with ES cells. The x-axis represents enrichment of gene expression in TS cells at 0 h through 14 d of differentiation (A); Cdx2- (B), Eomes- (C), or Gata3-overexpressing (D) ES cells compared with control ES cells; or TS cells compared with ES cells (E). Target genes are represented as a black and white heat map below the plot. (F–J) GSEA analysis of multiple versus single factor-occupied genes in TS cells. Expression of genes that are common targets of three and two factors is more enriched in TS cells (F); Cdx2- (G), Eomes- (H), and Gata3-overexpressing (I) ES cells; and TS cells compared with genes occupied by a single factor (J). (K–O) Distribution of enrichment scores of multiple factor-occupied genes in TS cells (K); Cdx2- (L), Eomes- (M), and Gata3-overexpressing (N) ES cells; and TS cells (O). (P) GSEA of AcH3 associated genes in undifferentiated and differentiated TS cells. Expression of AcH3 associated genes is enriched in undifferentiated TS cells. The x-axis represents enrichment of gene expression in TS cells at 0 h through 14 d of differentiation. Inset shows the distribution of enrichment scores of AcH3 associated genes in TS cells. (Q) Association between AcH3 marks and binding of TFs. (R) Profiles of AcH3 marks were centered on enrichment peaks [−2 kb, +2 kb] and clustered. (S) Heat map of TS cell transcriptome data sorted by the level of gene expression in TS cells at 0-h genomic profiles of AcH3 marks at genes expressed at low (T) and high (U) levels in undifferentiated versus differentiated TS cells. MA enrichment values adjusted to log2 and conservation are shown on the plot.


